Published: 2026-06-23T16:12:23.000Z
Chart USD/BRL Update: Pushing higher
3
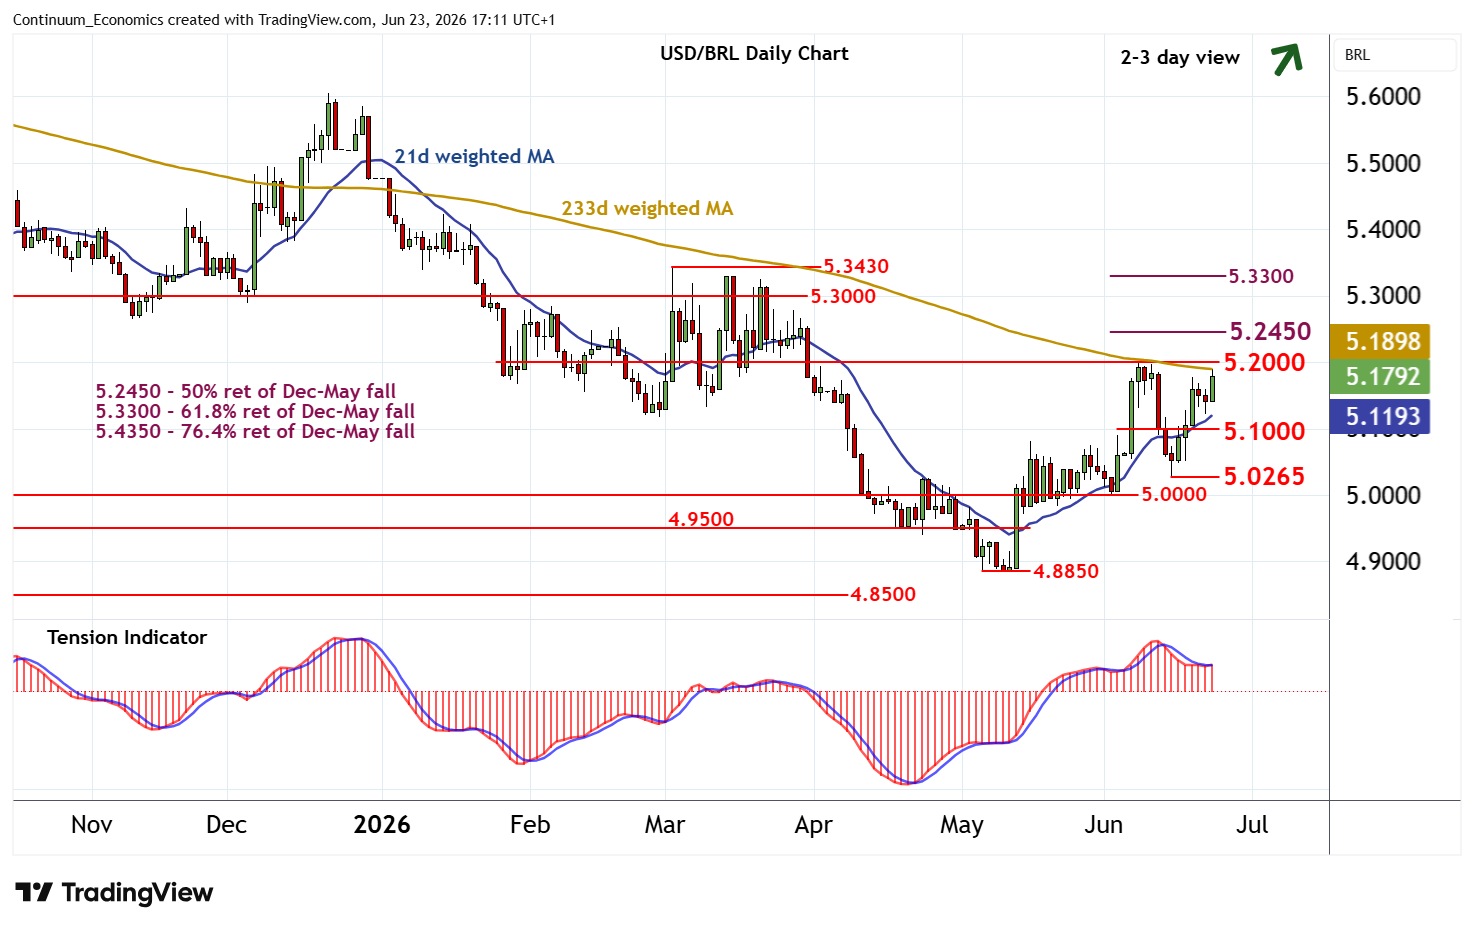
The bounce from the 5.0265 weekly low of 15 June is approaching strong resistance at 5.2000
| Levels | Imp | Comment | Levels | Imp | Comment | |||
|---|---|---|---|---|---|---|---|---|
| R4 | 5.3300 | ** | 61.8% ret of Dec-May fall | S1 | 5.1000 | * | break level | |
| R3 | 5.3000 | * | congestion | S2 | 5.0265 | * | 15 Jun (w) low | |
| R2 | 5.2450 | ** | 50% ret of Dec-May fall | S3 | 5.0000 | ** | congestion | |
| R1 | 5.2000 | ** | congestion | S4 | 4.9500 | ** | congestion |
Asterisk denotes strength of level
16:50 BST - The bounce from the 5.0265 weekly low of 15 June is approaching strong resistance at 5.2000. Daily readings are positive and broader weekly charts are also rising, highlighting room for further strength in the coming sessions. A close above here would turn sentiment positive and confirm continuation of May gains, opening up the 5.2450 Fibonacci retracement. Flattening overbought weekly stochastics could limit any initial tests in consolidation. Meanwhile, support is at 5.1000. A close beneath here, if seen, would turn sentiment neutral and prompt consolidation above 5.0265.