Published: 2026-10-27T03:50:15.000Z
Chart USD/IDR Updates: Extending September gains
2
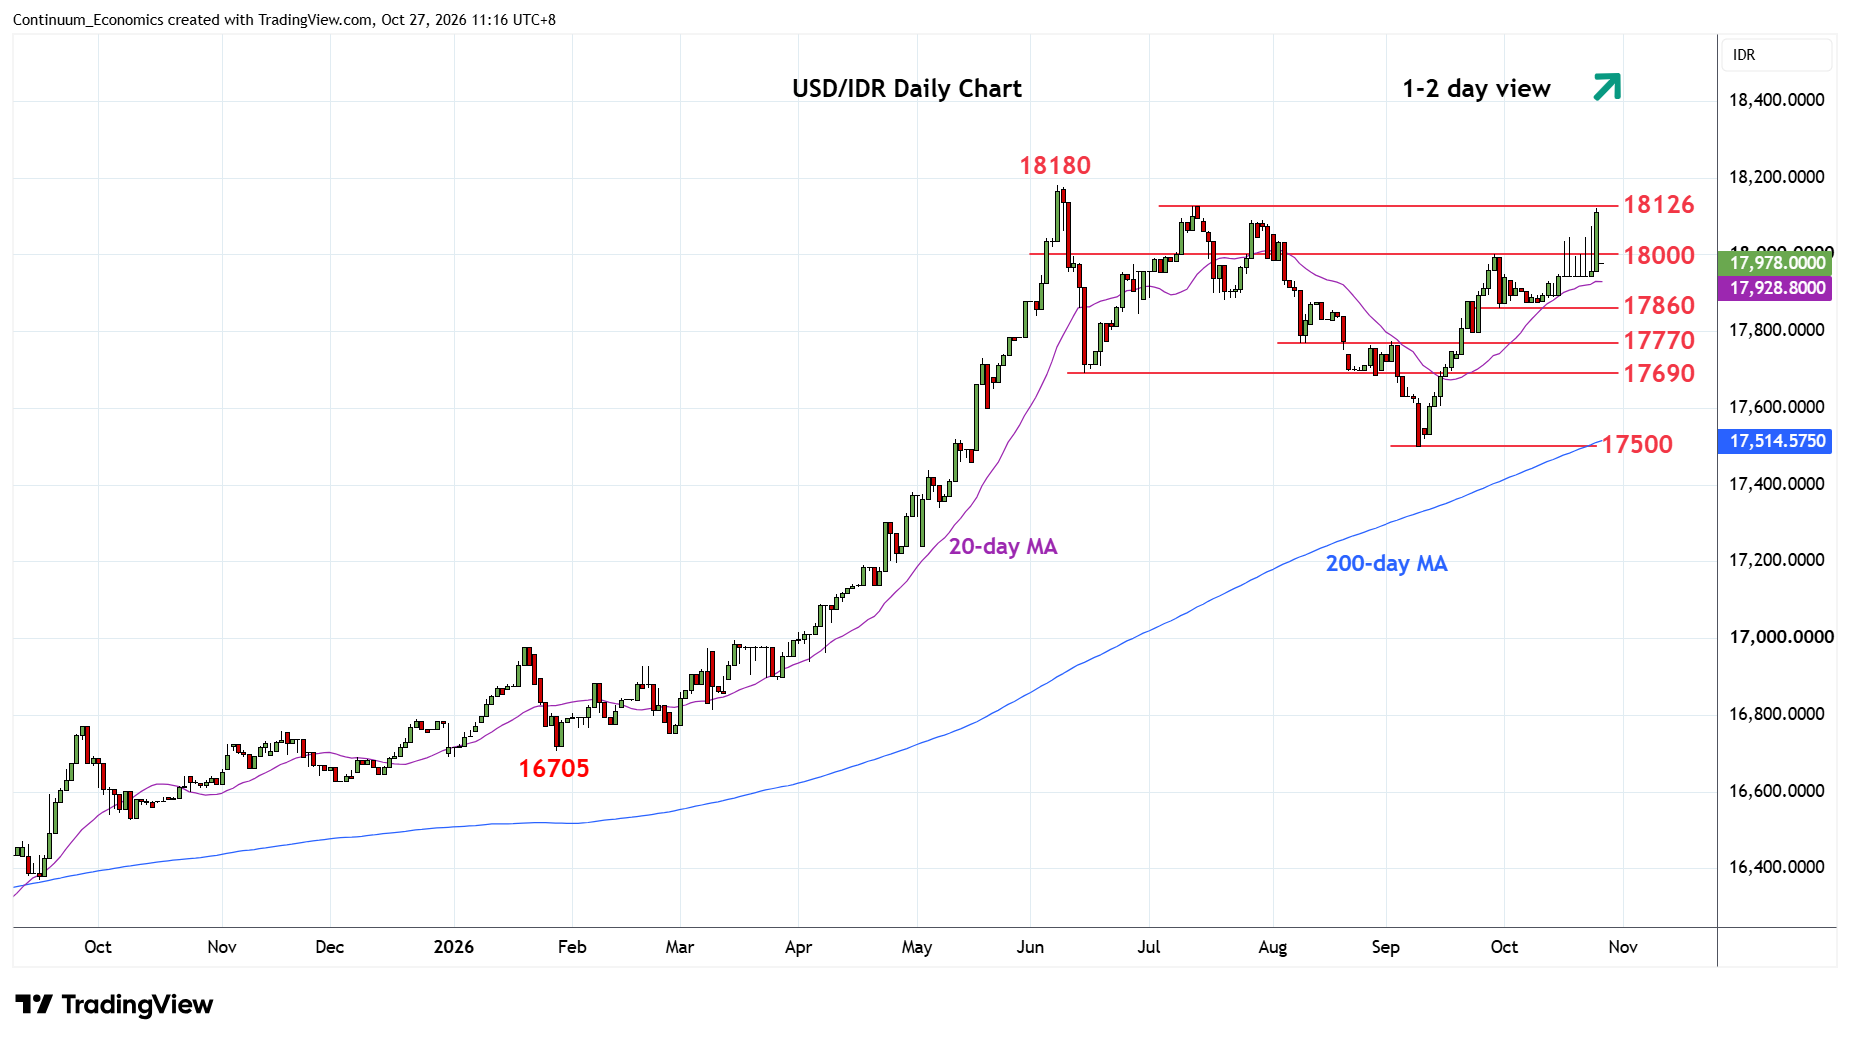
Break above the 18000 level has seen rally to retest the 18090/18126 July highs
| Levels | Imp | Comment | Levels | Imp | Comment | |||
|---|---|---|---|---|---|---|---|---|
| R4 | 18500 | figure | S1 | 17945 | congestion | |||
| R3 | 18300 | projection | S2 | 17860 | * | 30 Sep low | ||
| R2 | 18180 | ** | 8 Jun all-time high | S3 | 17770 | * | 10 Aug low | |
| R1 | 18126 | ** | 13 Jul high | S4 | 17690 | ** | Jun low |
Asterisk denotes strength of level
03:50 GMT - Break above the 18000 level has seen rally to retest the 18090/18126 July highs. Closed above the 18000 level suggest potential for extension of the broader gains from the 17500 September swing low to retest the 18180, 8 June all-time high. Above the latter will see scope to extend the underlying bull trend. Meanwhile, support remains at the 17945 congestion which extend to the 17880/17860 congestion area. Would take break of the latter to fade the upside pressure and see room for pullback to the 17800/17770 area and 17690 June low.