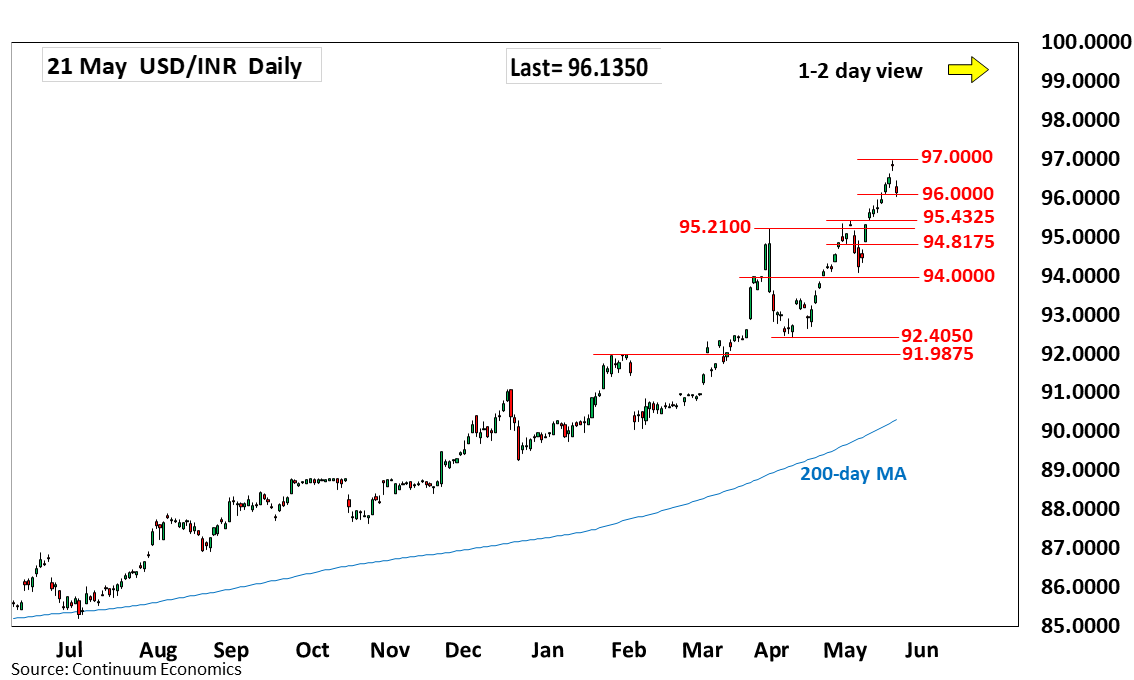
Chart USD/INR Update: Lower in consolidation from historic high
Lower opening see prices settling back from the 96.9600 historic high as prices consolidate strong gains from the 92.4050 April low
| Level | Comment | Level | Comment | |||||
|---|---|---|---|---|---|---|---|---|
| R4 | 98.0000 | figure, projection | S1 | 96.0000 | * | figure | ||
| R3 | 97.5000 | figure | S2 | 95.4325 | * | 5 May high | ||
| R2 | 97.1000 | projection | S3 | 95.2100 | ** | Mar high | ||
| R1 | 96.9600 | ** | 20 May all-time high | S4 | 94.8175 | * | 4 May low |
Asterisk denotes strength of level
05:30 GMT - Lower opening see prices settling back from the 96.9600 historic high as prices consolidate strong gains from the 92.4050 April low. Pullback see support starting at the 96.0000 level. Below here will ease the upside pressure and open up room for deeper pullback to strong support at 95.4325 and 95.2100, the 5 May and March highs. Would take break here to open up room for deeper pullback to retrace gains from the April low. Meanwhile, resistance at the 96.9600 high is expected to cap. Clearance, if seen, will see scope to target the 97.0000 figure and 97.1000 projection targets.