Chart USD/IDR Updates: Leaning lower
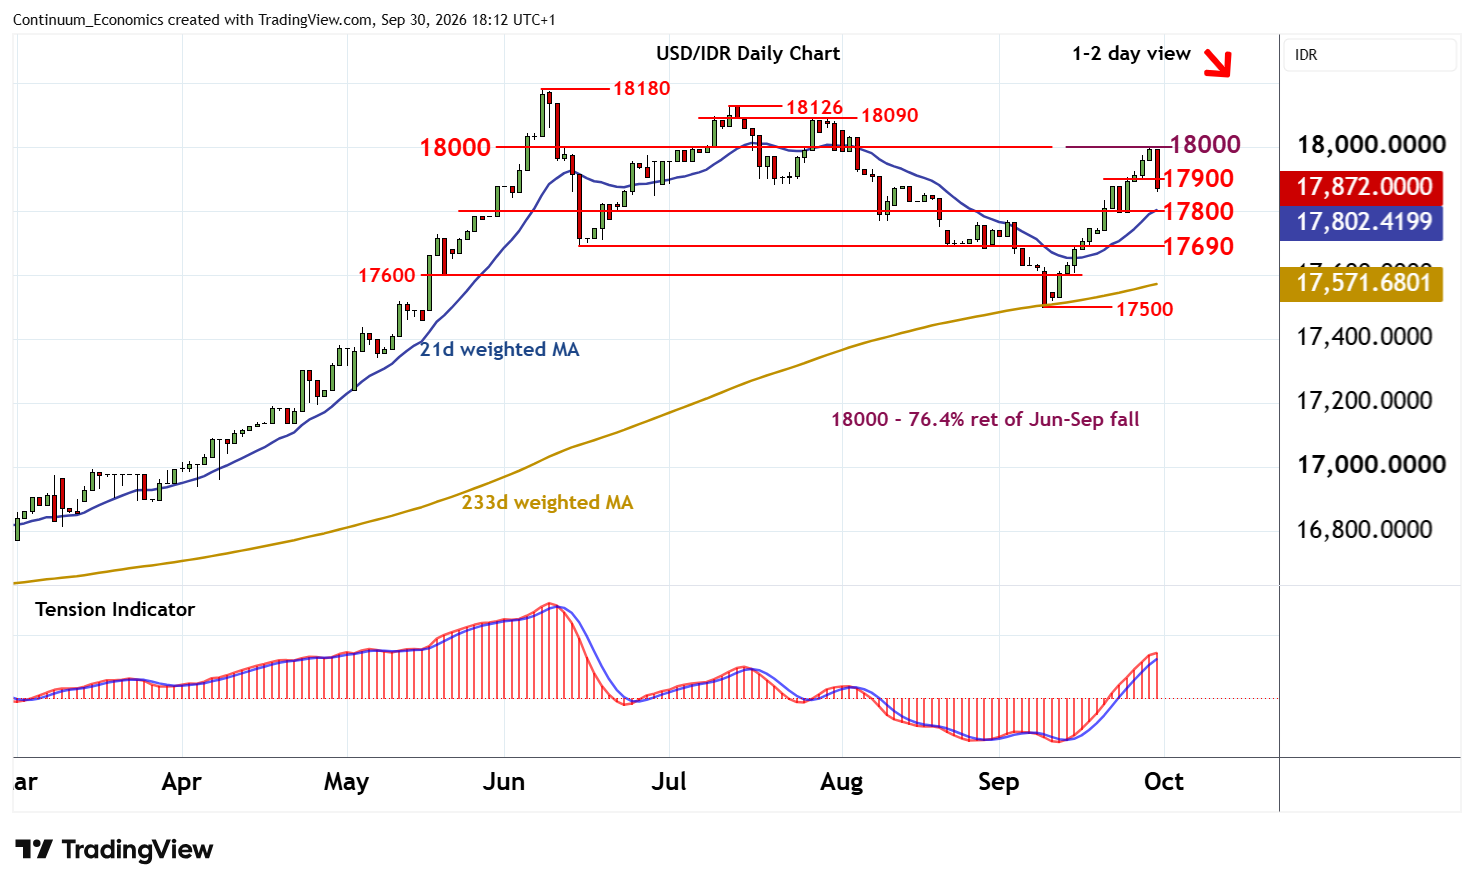
The anticipated pullback towards 17900 is extending
| Levels | Imp | Comment | Levels | Imp | Comment | |||
|---|---|---|---|---|---|---|---|---|
| R4 | 18126 | ** | 13 Jul (m) high | S1 | 17800 | * | congestion | |
| R3 | 18090 | * | 28 Jul high | S2 | 17690 | ** | Jun low | |
| R2 | 18000 | ** | cong; 76.4% ret | S3 | 17600 | * | congestion | |
| R1 | 17900 | * | pivot | S4 | 17500 | ** | 9 Sep (w) low |
Asterisk denotes strength of level
17:50 BST - The anticipated pullback towards 17900 is extending, with prices reaching 17840 before settling into consolidation. Overbought daily stochastics are unwinding and the positive daily Tension Indicator is flattening, suggesting room for further losses towards congestion support at 17800. However, improving weekly charts should limit any break in renewed buying interest above the 17690 low of June.
Meanwhile, a close back above 17900 will help to stabilise price action. But a close above strong resistance at 18000 is needed to turn sentiment positive once again and extend September gains initially towards the 18090 high of 28 July and the 18126 monthly high of 13 July.