Published: 2026-07-01T04:13:45.000Z
Chart USD/IDR Updates: Consolidating
2
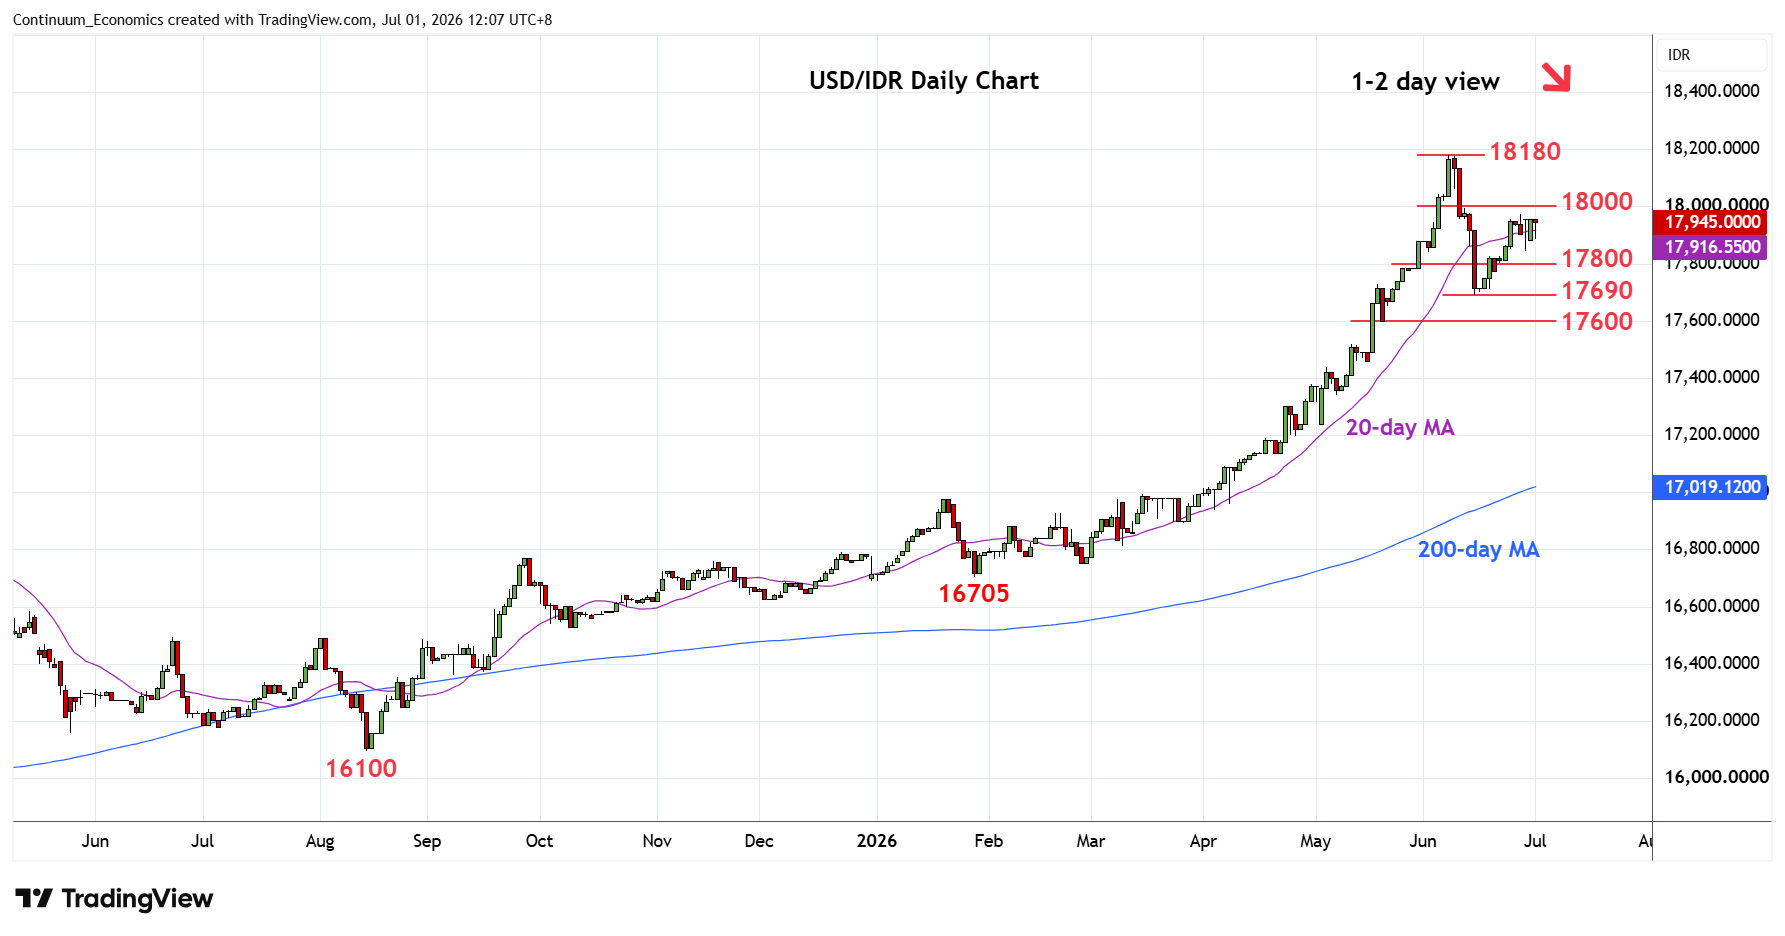
Little change, as prices extend consolidation below the 17974 high of last week
| Levels | Imp | Comment | Levels | Imp | Comment | |||
|---|---|---|---|---|---|---|---|---|
| R4 | 18470 | projection | S1 | 17800 | * | congestion | ||
| R3 | 18200 | congestion | S2 | 17690 | ** | 15 Jun low | ||
| R2 | 18180 | ** | 8 Jun all-time high | S3 | 17600 | * | 38.2% Jan/Jun rally | |
| R1 | 17974 | ** | 26 Jun high | S4 | 17520 | * | 12 May high |
Asterisk denotes strength of level
04:10 GMT - Little change, as prices extend consolidation below the 17974 high of last week. Overbought daily studies and weekly studies suggest room for deeper pullback to the 17800 support. Break of the latter will return focus to the downside for retest of the 17690 June low and see deeper pullback to retrace strong gains from the 16705 January low to support at 17600, 38.2% Fibonacci retracement. Meanwhile, resistance at the 17974/18000 high and congestion area is expected to cap and sustain losses from the 18180 high.