Published: 2026-06-16T05:00:33.000Z
Chart USD/INR Update: Still room to extend losses
3
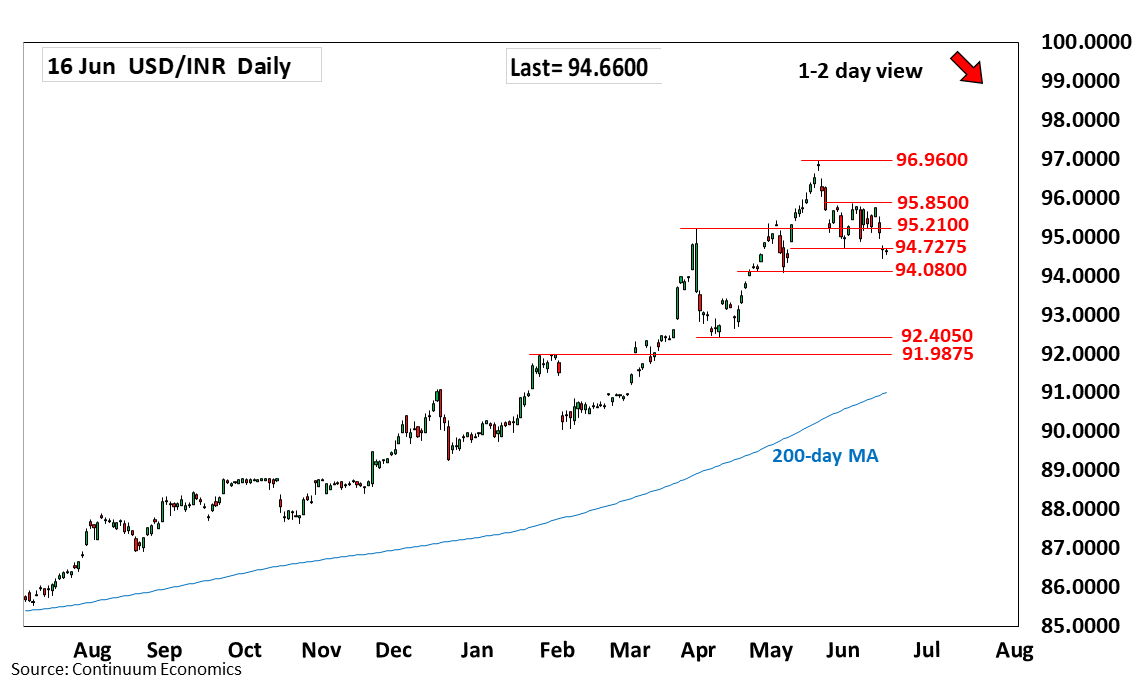
Break of the 94.7275 low see prices extending losses from the 96.9600 May all-time high to reach 94.4525 low
| Level | Comment | Level | Comment | |||||
|---|---|---|---|---|---|---|---|---|
| R4 | 96.9600 | ** | 20 May all-time high | S1 | 94.4525 | * | 15 Jun low | |
| R3 | 96.0000 | * | figure | S2 | 94.0800 | ** | May low | |
| R2 | 95.8500 | ** | 3 Jun high | S3 | 93.4100 | ** | 15 Apr high | |
| R1 | 95.2100 | * | Mar high | S4 | 93.0000 | * | figure, congestion |
Asterisk denotes strength of level
05:00 GMT - Break of the 94.7275 low see prices extending losses from the 96.9600 May all-time high to reach 94.4525 low. The downside stays in focus and lower will see room to further retrace gains from the April low to strong support at the 94.0800/94.0000 area. Lower still, will see room for extension to support at 93.4100 then the 93.0000 figure. Meanwhile, resistance is lowered to 95.2100 March high which is expected to cap and sustain losses from resistance at the 95.8500, 3 June lower high.