Published: 2026-07-03T02:10:07.000Z
Chart USD/SGD Update: Under pressure
-
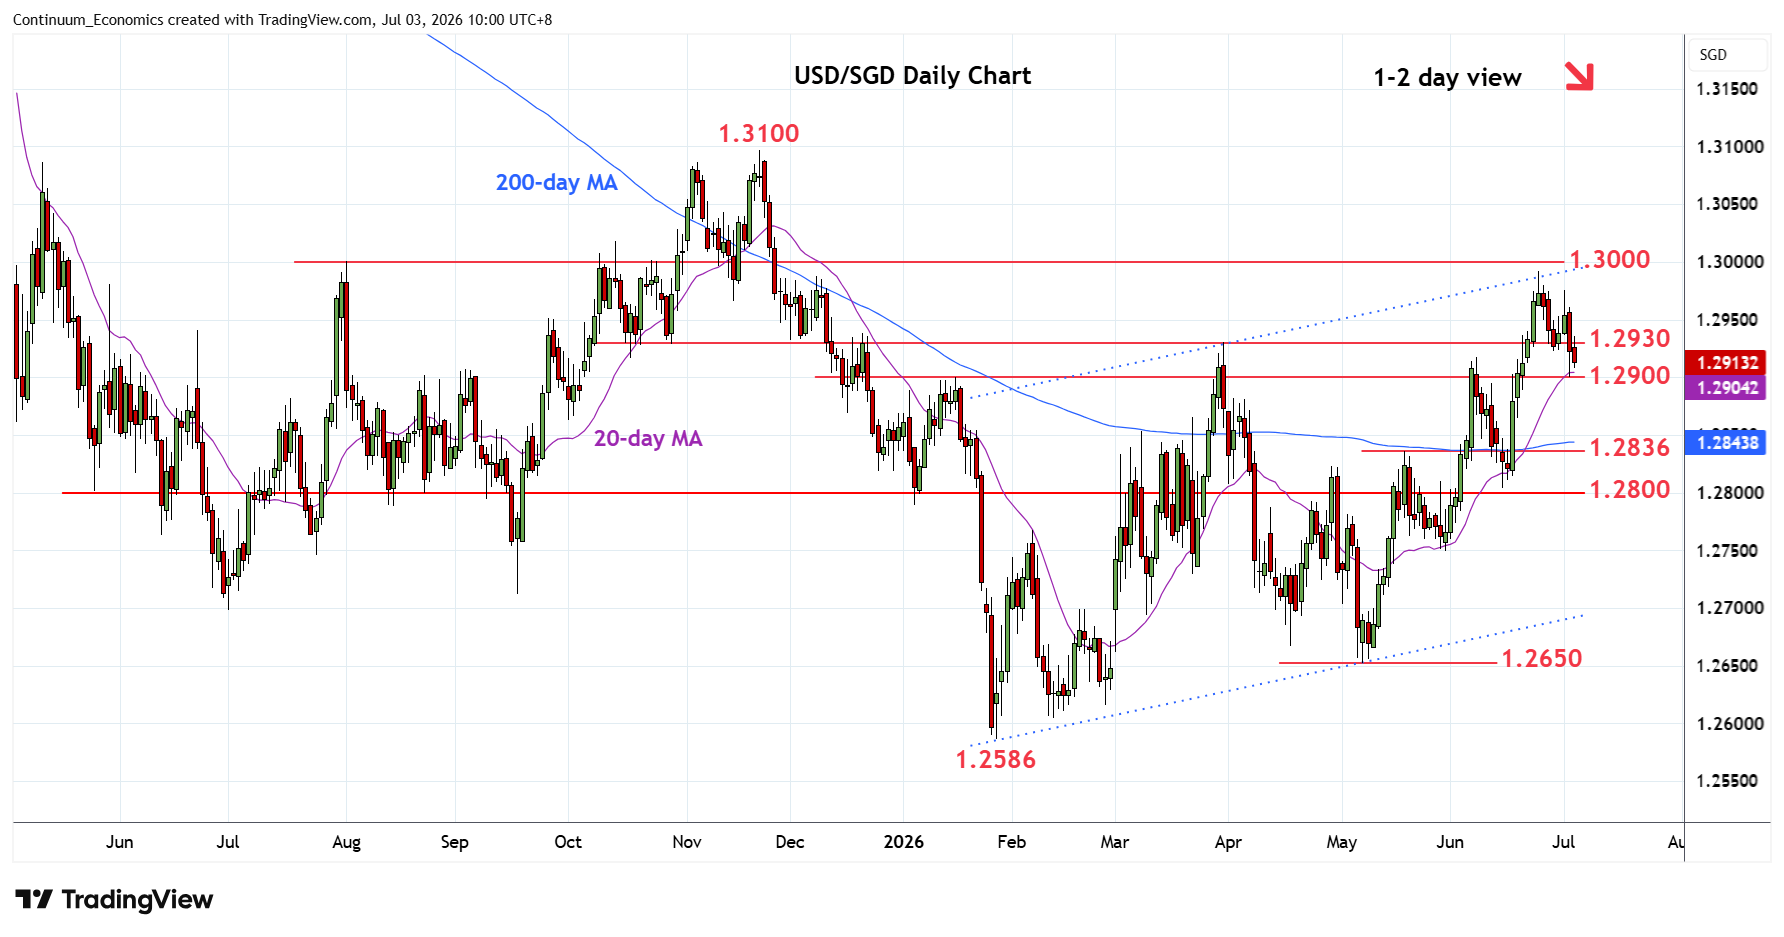
Consolidation at the 1.2930/17 support has given way to break to test the 1.2900 support
| Level | Comment | Level | Comment | ||||
|---|---|---|---|---|---|---|---|
| R4 | 1.3050 | * | congestion | S1 | 1.2900 | * | congestion |
| R3 | 1.3000 | ** | figure, congestion | S2 | 1.2850 | * | congestion |
| R2 | 1.2985 | ** | Dec high | S3 | 1.2836 | ** | May high |
| R1 | 1.2930 | * | Mar high | S4 | 1.2805/00 | ** | 15 Jun low, congestion |
Asterisk denotes strength of level
02:10 GMT - Consolidation at the 1.2930/17 support has given way to break to test the 1.2900 support. Reaction here is expected to give way to fresh selling pressure later to extend losses from the 1.2985 high. Break will turn focus lower and see room to strong support at the 1.2850/36 congestion and May high. Lower still, will see scope to 1.2805/00 area. Meanwhile, resistance at the 1.2930/50 congestion and March high now expected to cap and sustain pullback from the 1.2985 high and channel resistance.