Published: 2026-07-29T05:06:58.000Z
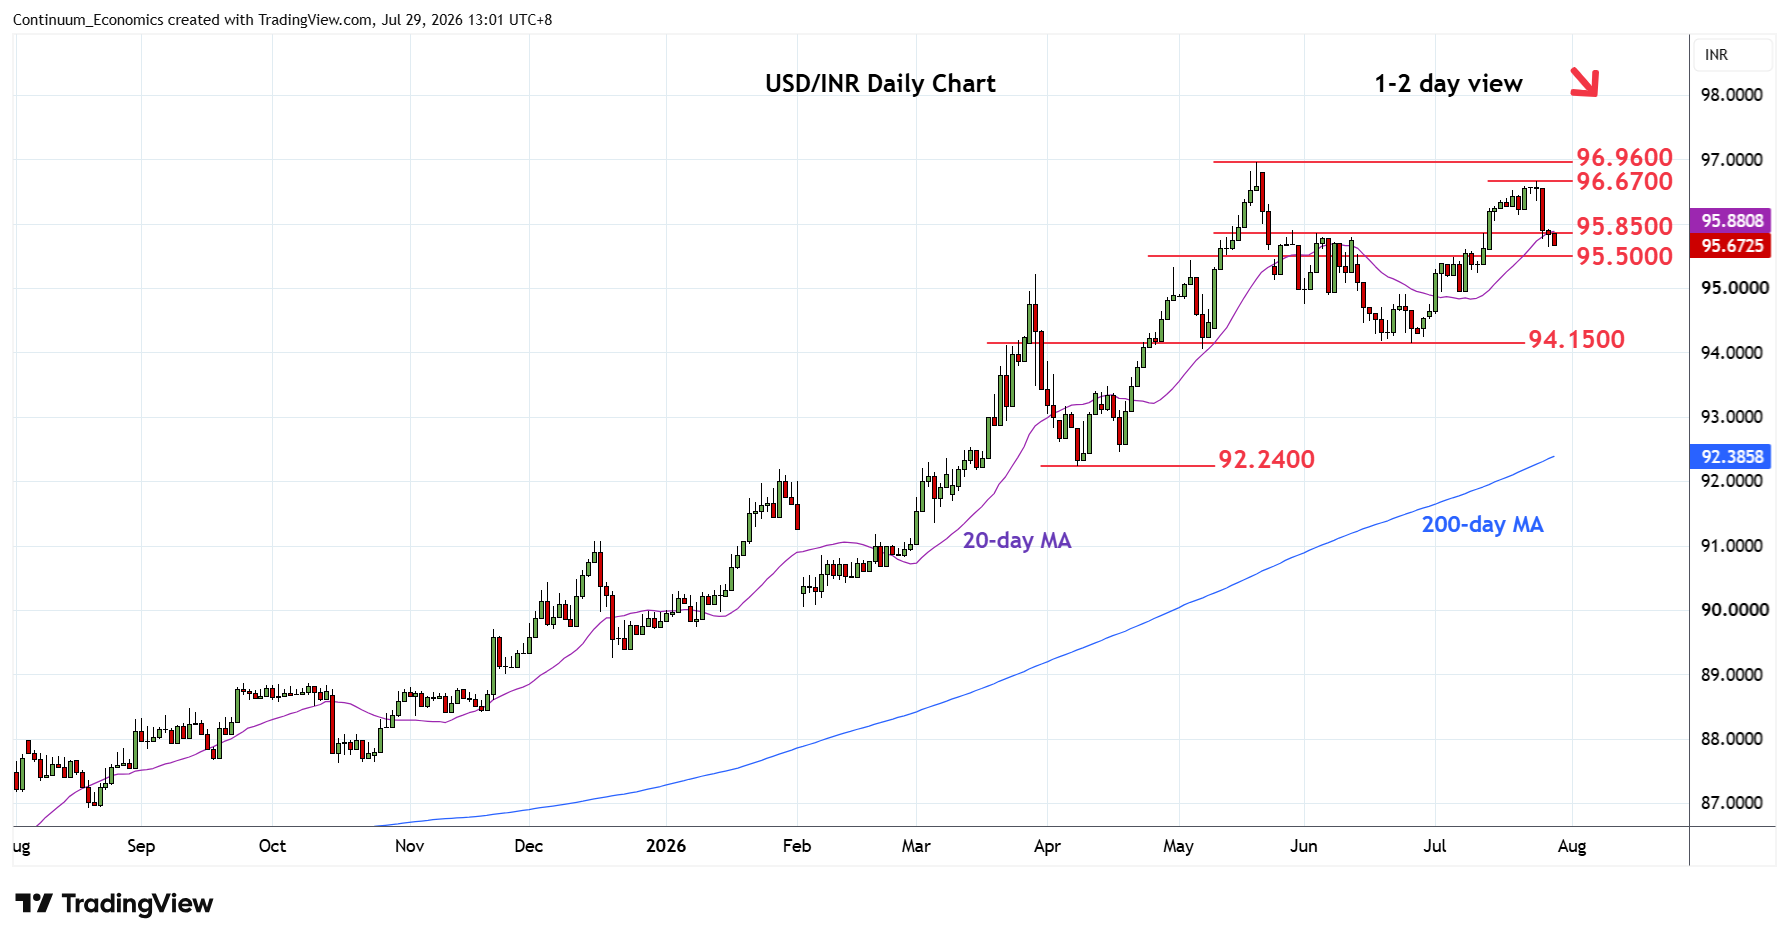
Chart USD/INR Update: Extending losses from 96.6700 high
2
Prices remains under pressure following rejection from the 96.6700 high of last week
| Level | Comment | Level | Comment | |||||
|---|---|---|---|---|---|---|---|---|
| R4 | 97.0000 | * | figure | S1 | 95.5000 | * | congestion | |
| R3 | 96.9600 | ** | 20 May all-time high | S2 | 94.9000 | ** | 23 Jun high | |
| R2 | 96.6700 | * | 24 Jul high | S3 | 94.1500 | ** | Jun low | |
| R1 | 96.0000 | * | congestion | S4 | 93.4700 | * | 15 Apr high |
Asterisk denotes strength of level
05:00 GMT - Prices remains under pressure following rejection from the 96.6700 high of last week. Break of the 96.0000/95.8500 support opens up room for deeper pullback to retrace strong gains from the 94.1500 June low and see room for extension to the 95.5000 congestion. Below this will turn focus to the strong support at 95.0000/94.9000 area. Meanwhile, resistance is lowered to the 96.0000 congestion which should cap and sustain losses from the 96.6700 high of 24 July.