Published: 2026-10-07T05:05:01.000Z
Chart USD/CNH Update: Leaning lower to pressure 6.7000 support
1
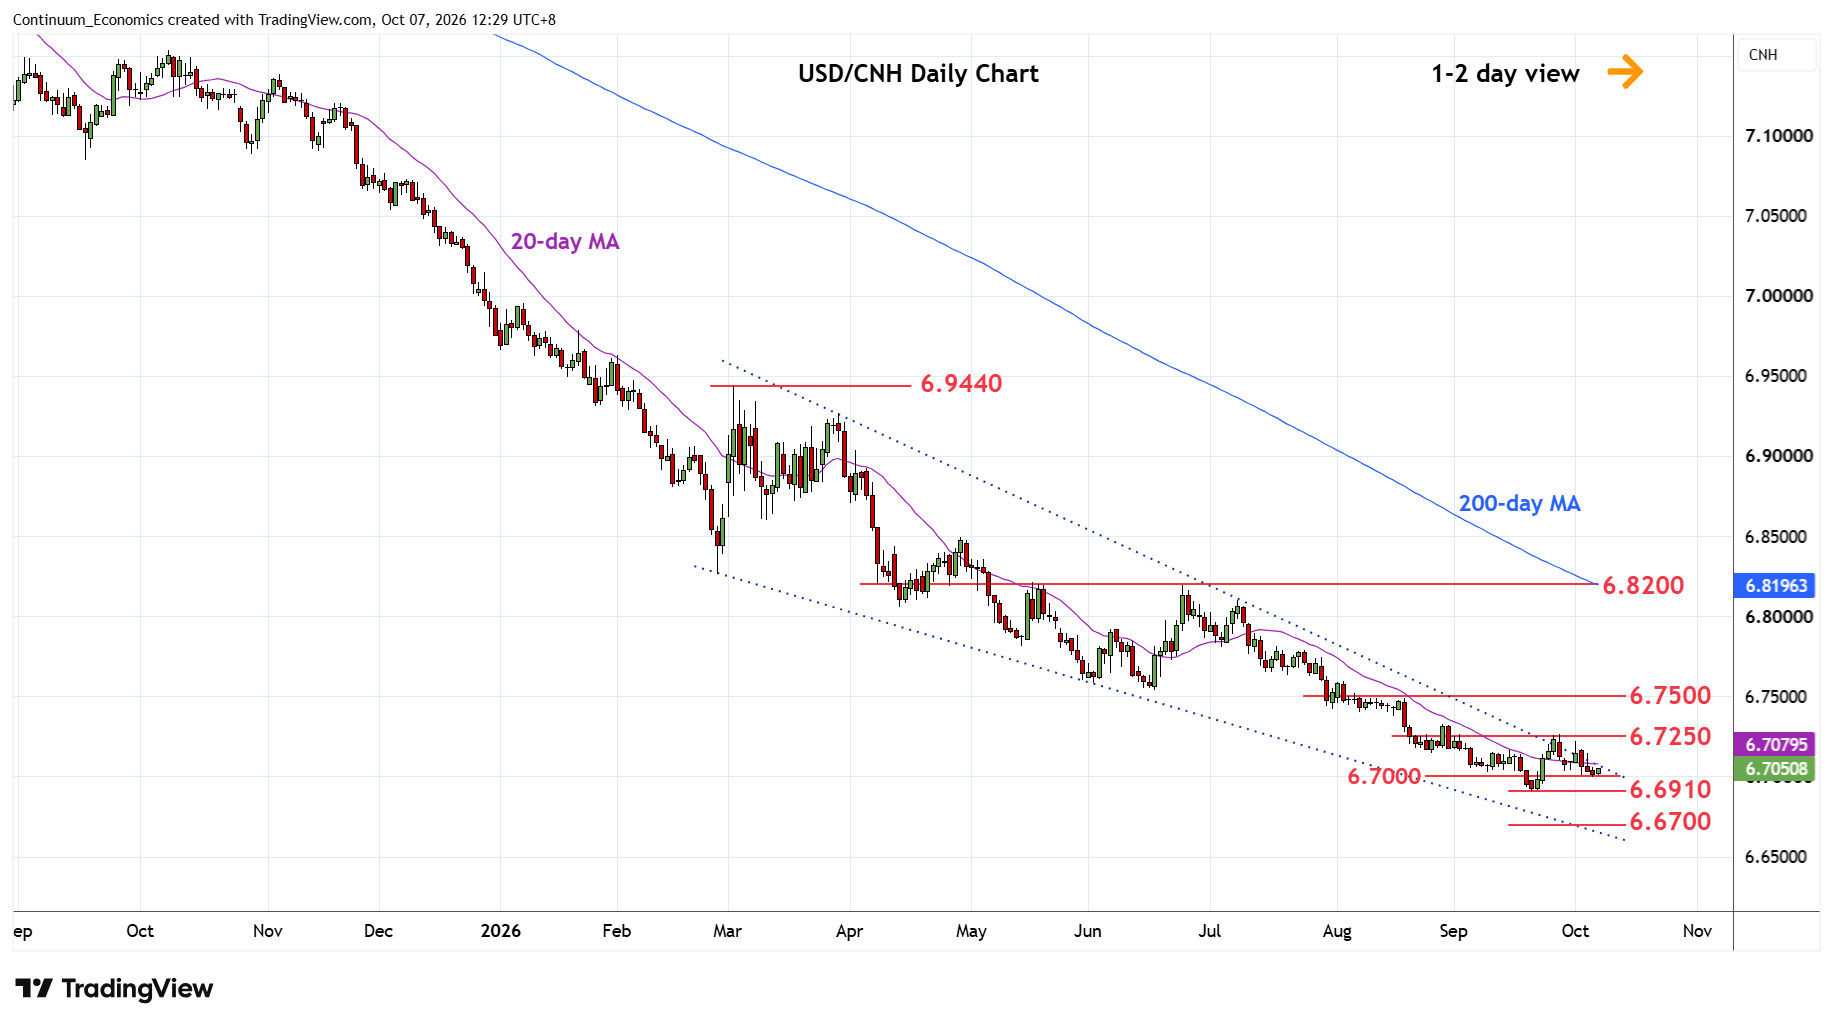
Drift lower from the 6.7250 resistance has seen losses to pressure support at the 6.7000 figure
| Level | Imp | Comment | Level | Imp | Comment | |||
|---|---|---|---|---|---|---|---|---|
| R4 | 6.7630 | * | 21 Jul low | S1 | 6.7000 | * | figure | |
| R3 | 6.7500/40 | ** | congestion, Jun low | S2 | 6.6910 | ** | 21 Sep YTD low | |
| R2 | 6.7400 | * | 7 Aug low, congestion | S3 | 6.6700 | ** | 2023 year low | |
| R1 | 6.7250 | * | congestion | S4 | 6.6500 | * | congestion |
Asterisk denotes strength of level
04:50 GMT - Drift lower from the 6.7250 resistance has seen losses to pressure support at the 6.7000 figure. Break here will open up room for retest of the 6.6910 September current year low and see room to extend the underlying bear trend from the 2025 year high. Lower will see scope to the 6.6700, 2023 year low. Meanwhile, resistance remains at the 6.7200/50 congestion area. Would take break here to ease the downside pressure and open up room for stronger gains to retrace losses from the 6.8200, June high. Higher will see room to resistance at the 6.7330/6.7400 area.