Published: 2026-08-17T03:09:27.000Z
Chart USD/MYR Update: Leaning lower from the 4.0950, July high
2
Leaning lower in consolidation below the 4.0950 July high as daily and weekly studies unwind overbought readings
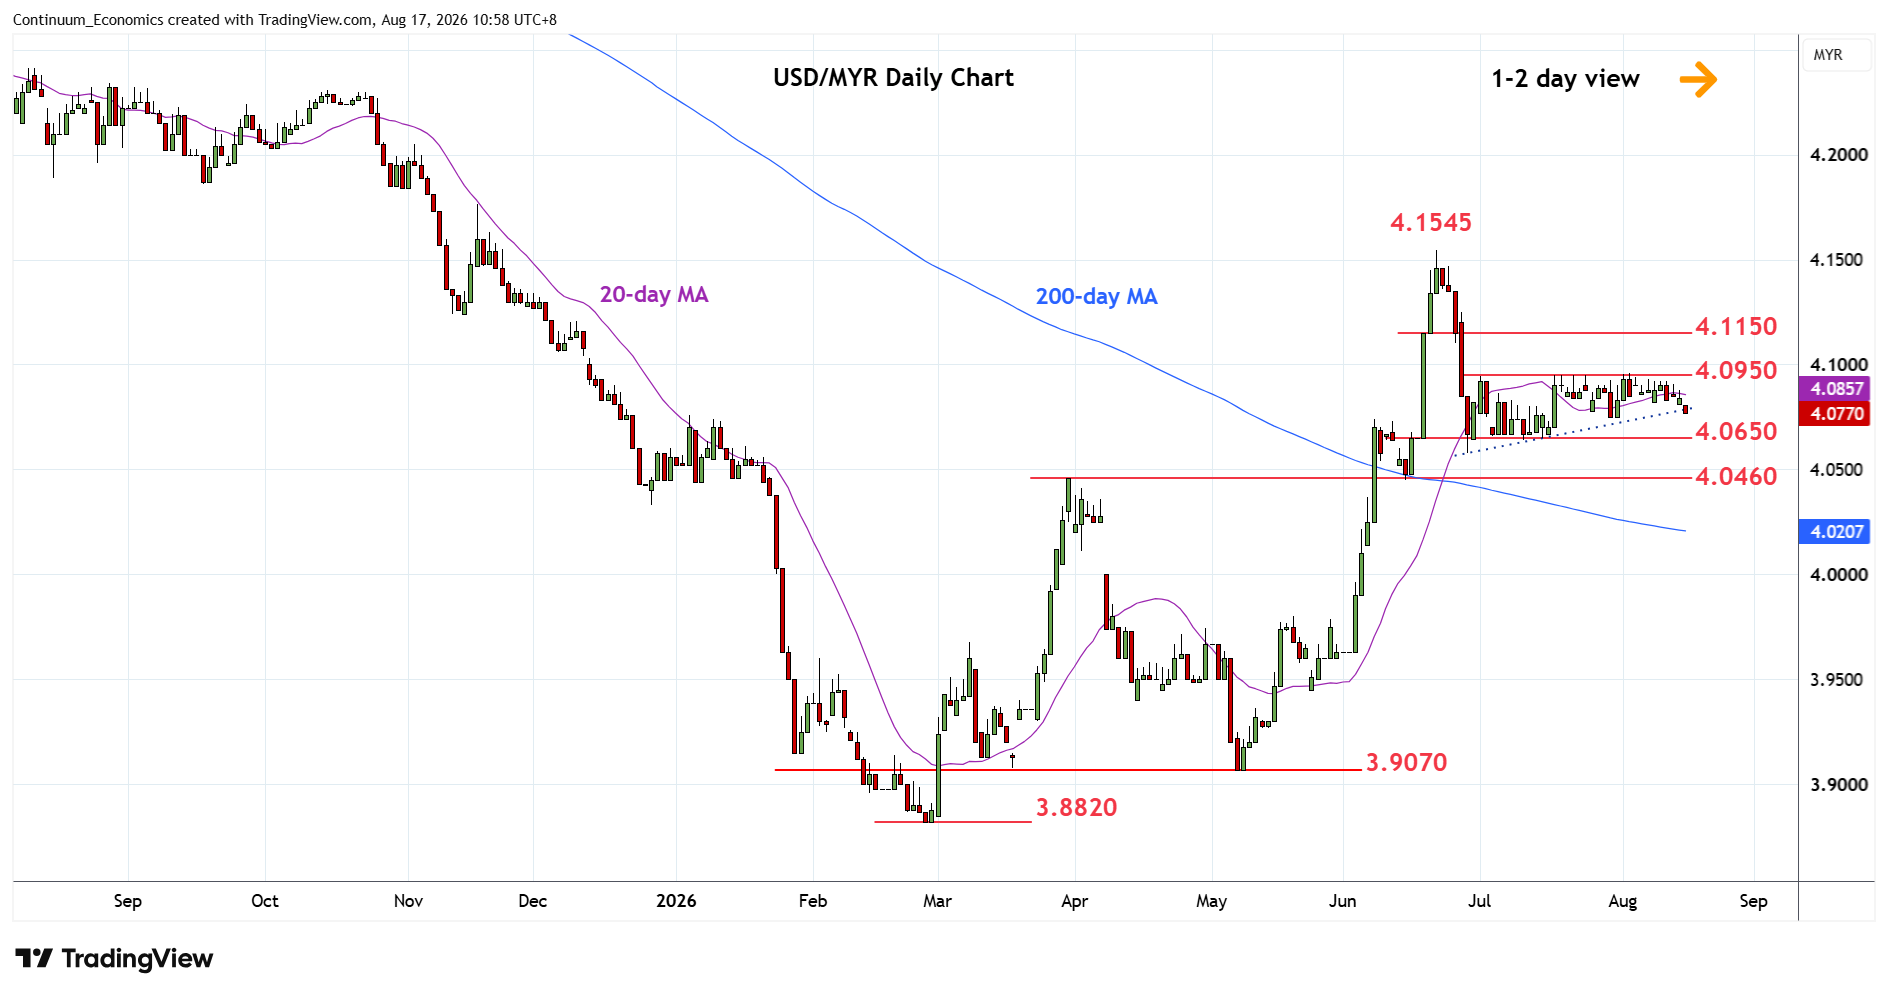
| Levels | Imp | Comment | Levels | Imp | Comment | |||
|---|---|---|---|---|---|---|---|---|
| R4 | 4.1545 | ** | 22 Jun YTD high | S1 | 4.0750/00 | 30 Jul low, congestion | ||
| R3 | 4.1350 | * | congestion | S2 | 4.0650/00 | ** | congestion | |
| R2 | 4.1150 | * | congestion | S3 | 4.0460 | ** | Mar high | |
| R1 | 4.0950 | * | Jul high | S4 | 4.0300 | * | 50% May/Jun rally |
Asterisk denotes strength of level
03:10 GMT - Leaning lower in consolidation below the 4.0950 July high as daily and weekly studies unwind overbought readings. Pullback see support starting at the 4.0750/4.0650 area then the 4.0600 level. Break here will extend losses from the 4.1545 June current year high to retrace the rally from the 3.9070, May low. Break here will see extension to strong support at 4.0460/4.0400 area. Lower still, will see room to 4.0300, 50% Fibonacci retracement. Meanwhile, resistance at 4.0950 July highs are expected to cap.