Chart USD/SGD Update: Further consolidation - background studies rising
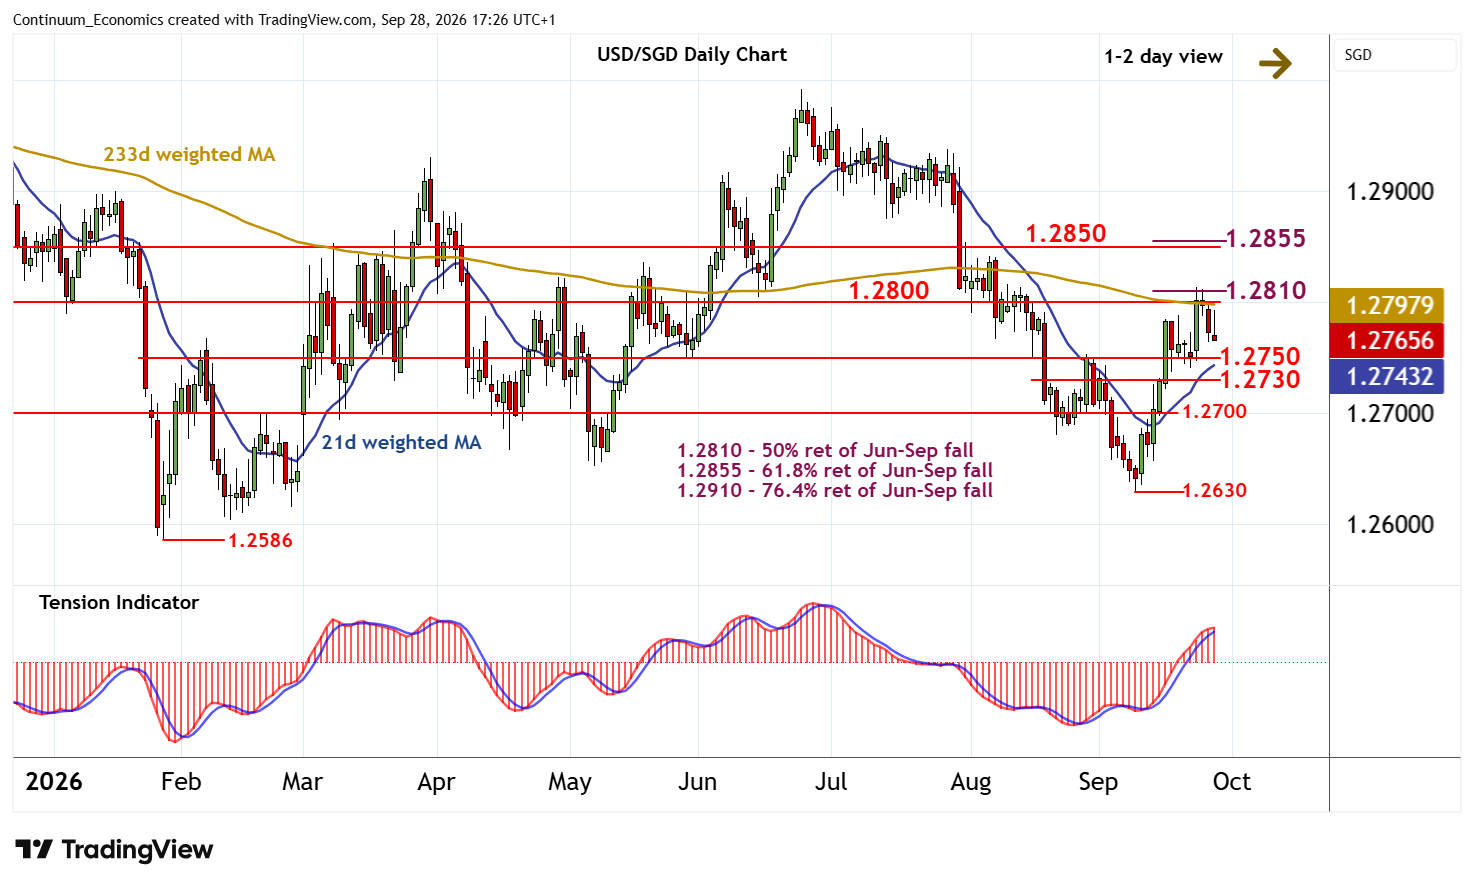
Little change, as mixed intraday studies keep near-term sentiment cautious and extend the pullback from strong resistance at congestion around 1.2800 and the 1.2810 Fibonacci retracement
| Level | Comment | Level | Comment | ||||
|---|---|---|---|---|---|---|---|
| R4 | 1.2900/10 | ** | congestion; 76.4% ret | S1 | 1.2750 | * | break level |
| R3 | 1.2875 | ** | 14 Jul low | S2 | 1.2730 | * | congestion |
| R2 | 1.2850/55 | * | congestion; 61.8% ret | S3 | 1.2700 | * | congestion, Jul 2025 yr low |
| R1 | 1.2800/10 | ** | congestion, 50% ret | S4 | 1.2680 | * | Aug low |
Asterisk denotes strength of level
16:55 BST - Little change, as mixed intraday studies keep near-term sentiment cautious and extend the pullback from strong resistance at congestion around 1.2800 and the 1.2810 Fibonacci retracement. Daily stochastics are turning lower in overbought areas, suggesting room for a test of support at 1.2750. But the positive daily Tension Indicator and improving weekly charts should limit any deeper losses in renewed buying interest towards congestion around 1.2730.
Following cautious/corrective trade, fresh gains are looked for. However, a close above 1.2800/10 is needed to turn sentiment positive and extend September gains towards strong resistance at 1.2850/55.