Published: 2026-05-22T02:52:32.000Z
Chart USD/THB Update: Extend consolidation within 32.80/32.50 range
1
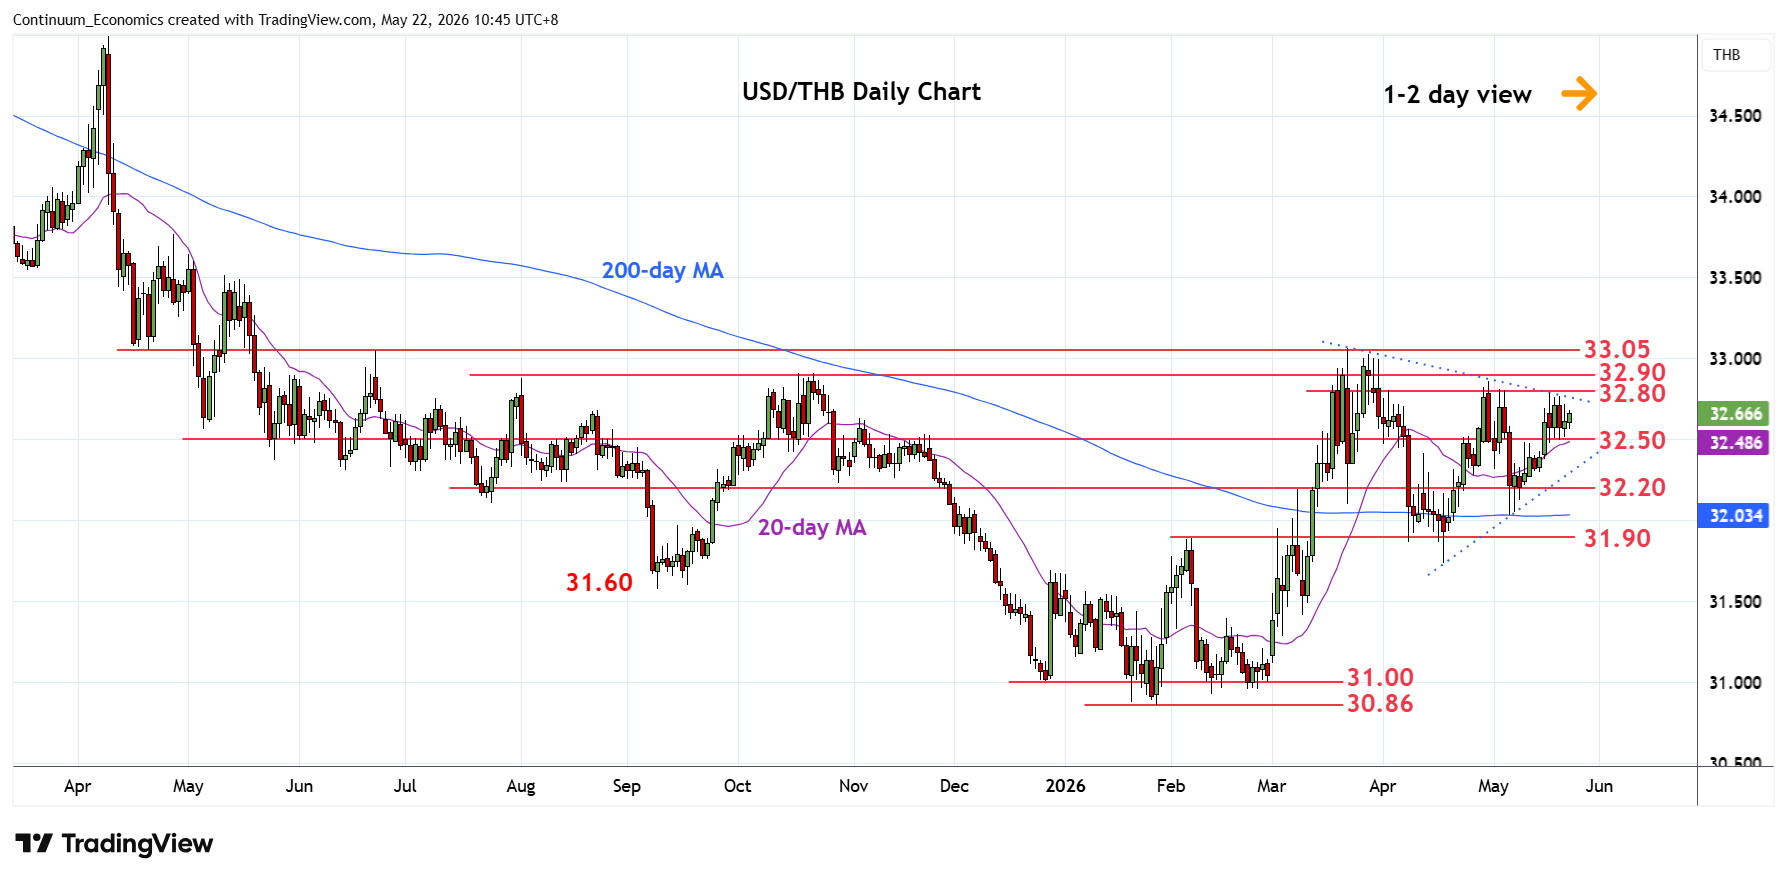
Extend consolidation within the 32.80/32.50 range
| Level | Comment | Level | Comment | |||||
|---|---|---|---|---|---|---|---|---|
| R4 | 33.20 | * | congestion | S1 | 32.50/40 | ** | congestion | |
| R3 | 33.05 | ** | 23 Mar YTD high | S2 | 32.20 | * | congestion | |
| R2 | 32.90 | * | Oct high | S3 | 32.03 | ** | 6 May low | |
| R1 | 32.80/85 | ** | congestion, 30 Apr high | S4 | 31.90 | * | Feb high |
Asterisk denotes strength of level
02:45 GMT - Extend consolidation within the 32.80/32.50 range but the resulting flag pattern suggest scope for break here to extend the broader gains from the 31.74 April low. Higher will see scope to retest resistance at the 32.90 October high and 33.05, 23 March current year high. Break here will further extend gains from the January low to retrace losses from the 35.00, April 2025 year high. Meanwhile, support remains at the 32.50/40 congestion area. Would take break here to return focus to the downside and see pullback to support at 32.20 congestion and 32.00 level.