Published: 2026-06-03T12:02:40.000Z
Chart EUR/CAD Update: Range extension
1
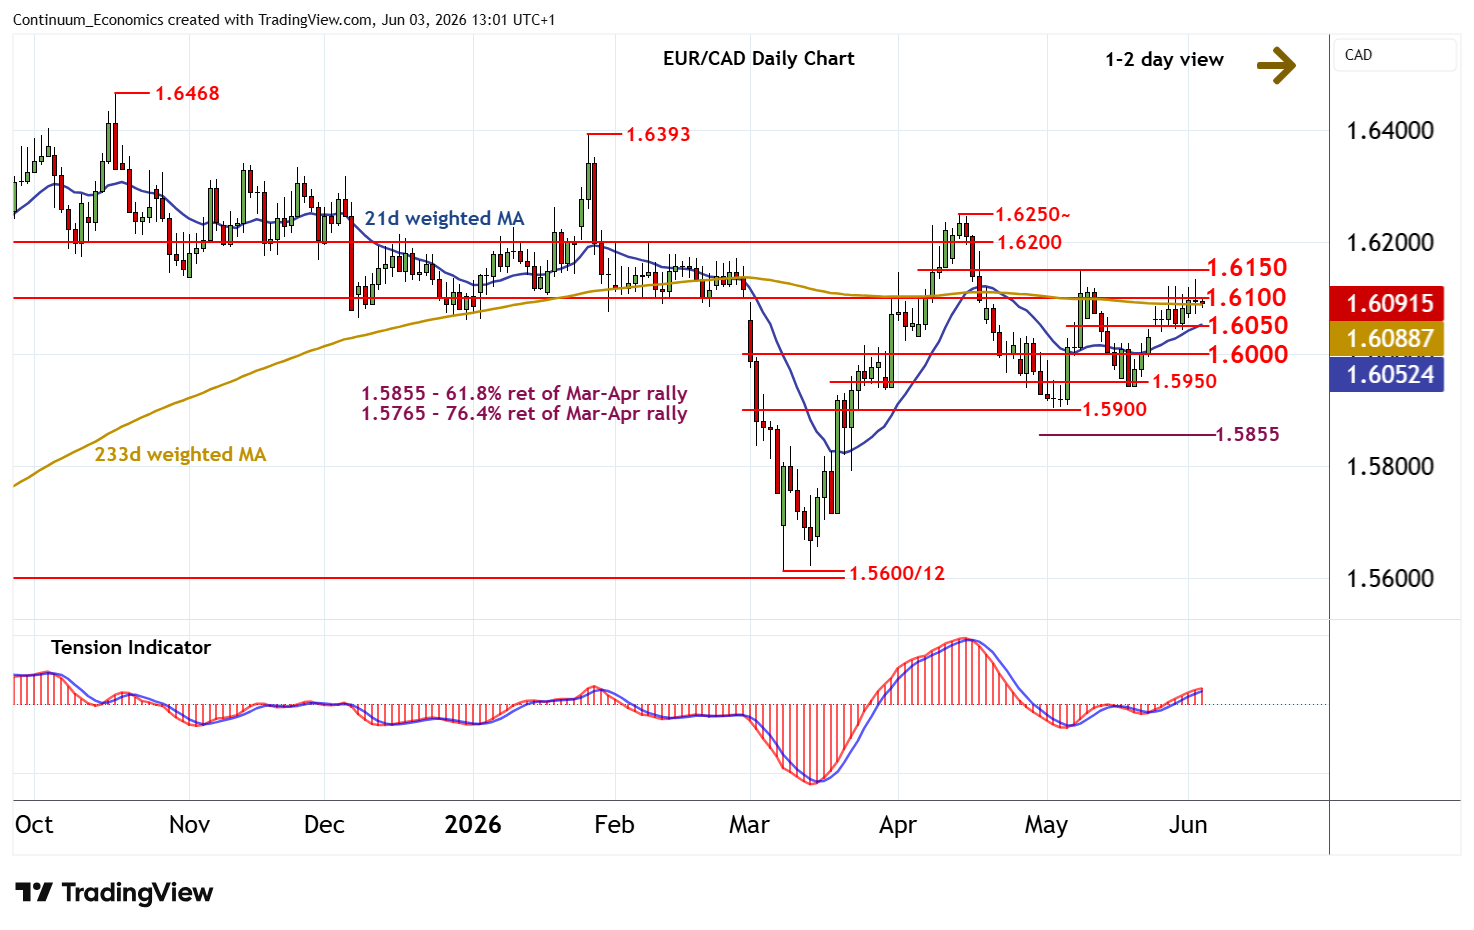
Anticipated tests higher have proven short-lived, as overbought intraday studies unwind
| Level | Comment | Level | Comment | |||||
|---|---|---|---|---|---|---|---|---|
| R4 | 1.6250~ | ** | 14 Apr (m) high | S1 | 1.6050 | congestion | ||
| R3 | 1.6200 | ** | congestion | S2 | 1.6000 | * | break level | |
| R2 | 1.6150 | * | break level | S3 | 1.5950 | * | congestion | |
| R1 | 1.6100 | ** | break level | S4 | 1.5900 | ** | break level |
Asterisk denotes strength
12:20 BST - Anticipated tests higher have proven short-lived, as overbought intraday studies unwind, with prices currently balanced in fresh consolidation beneath 1.6100. The rising daily Tension Indicator is showing signs of flattening, and overbought daily stochastics are also maturing, suggesting room for a minor pullback towards congestion support at 1.6050. However, rising weekly charts should limit any deeper losses in renewed buying interest above 1.6000. Meanwhile, resistance is at 1.6100. But a close above 1.6150, not yet seen, would improve sentiment and extend May gains towards congestion resistance at 1.6200.