Published: 2026-06-04T05:54:28.000Z
Chart USD/IDR Updates: Fresh historic high above 18000
4
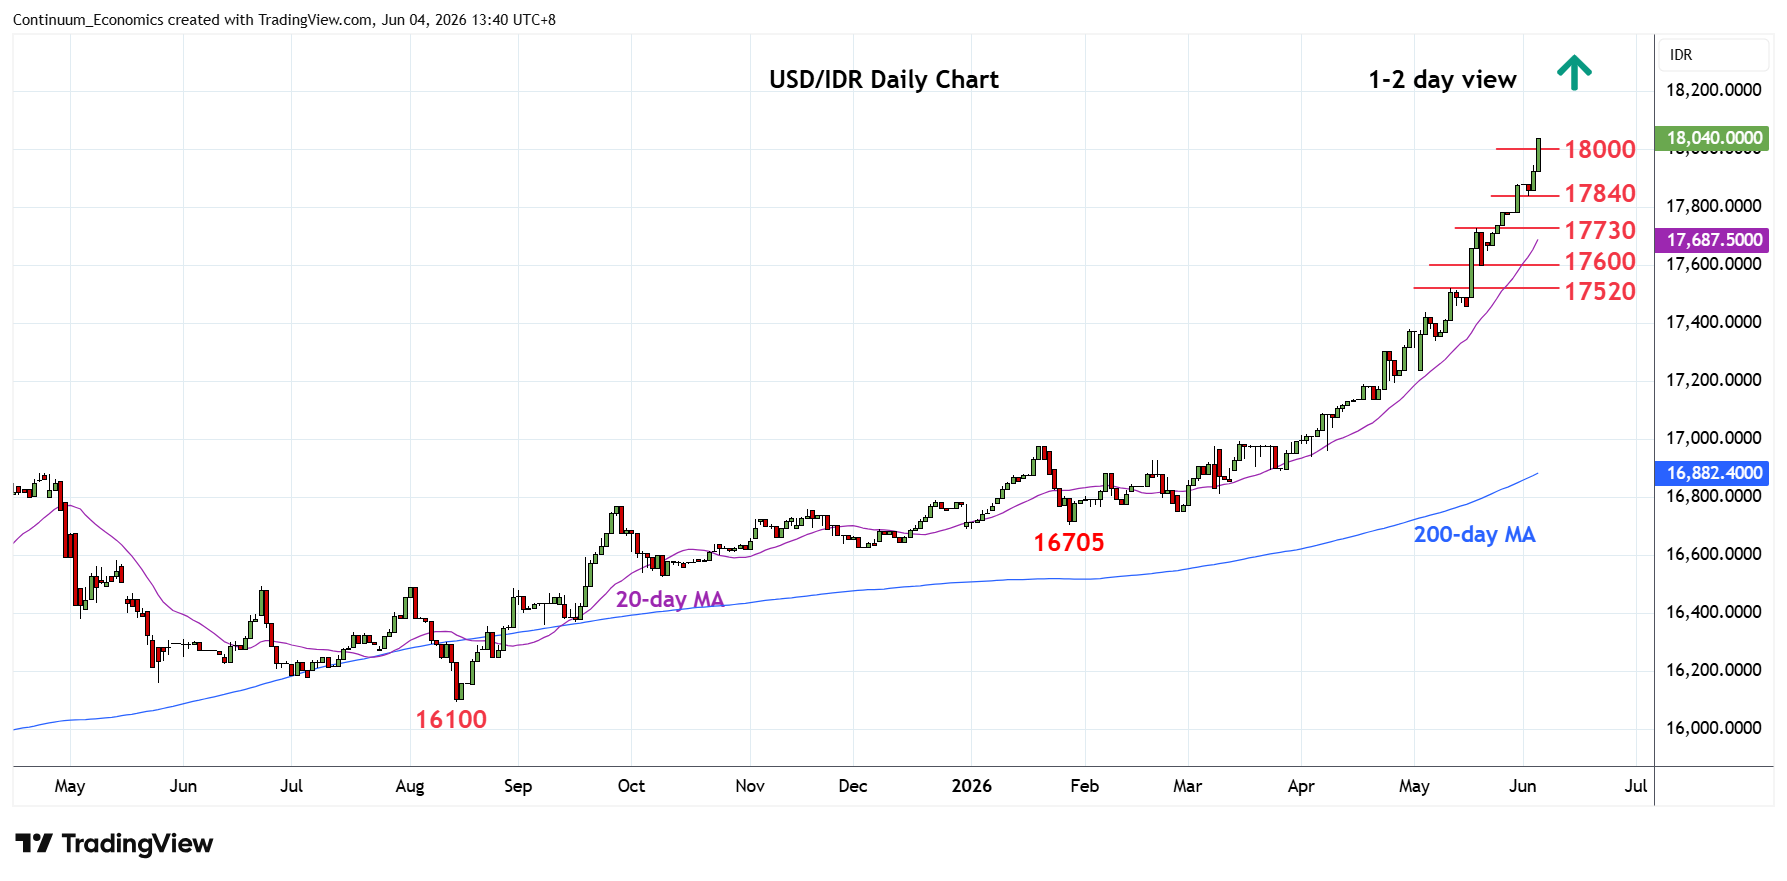
Still no let up in the bullish momentum as prices extend parabolic gains from the 16705 January
| Levels | Imp | Comment | Levels | Imp | Comment | |||
|---|---|---|---|---|---|---|---|---|
| R4 | 19000 | projection | S1 | 17840 | * | 2 Jun low | ||
| R3 | 18500 | projection | S2 | 17730 | * | 19 May high | ||
| R2 | 18150 | projection | S3 | 17600 | * | congestion | ||
| R1 | 18040 | intraday high | S4 | 17520 | * | 12 May high |
Asterisk denotes strength of level
05:50 GMT - Still no let up in the bullish momentum as prices extend parabolic gains from the 16705 January low to surge above the 18000 level. Higher still will see room to 18150 and 18500 projection targets. However, overbought daily and weekly studies caution corrective pullback. Meanwhile, support remains at the 17840/17800 area and below here needed to ease the upside pressure and see room for deeper corrective pullback to retrace strong gains from the January low. Lower will see room to support at the 17730/17600, 19 May high and congestion area.