Published: 2026-07-13T03:02:35.000Z
Chart USD/SGD Update: Turned up from the 1.2900 level
2
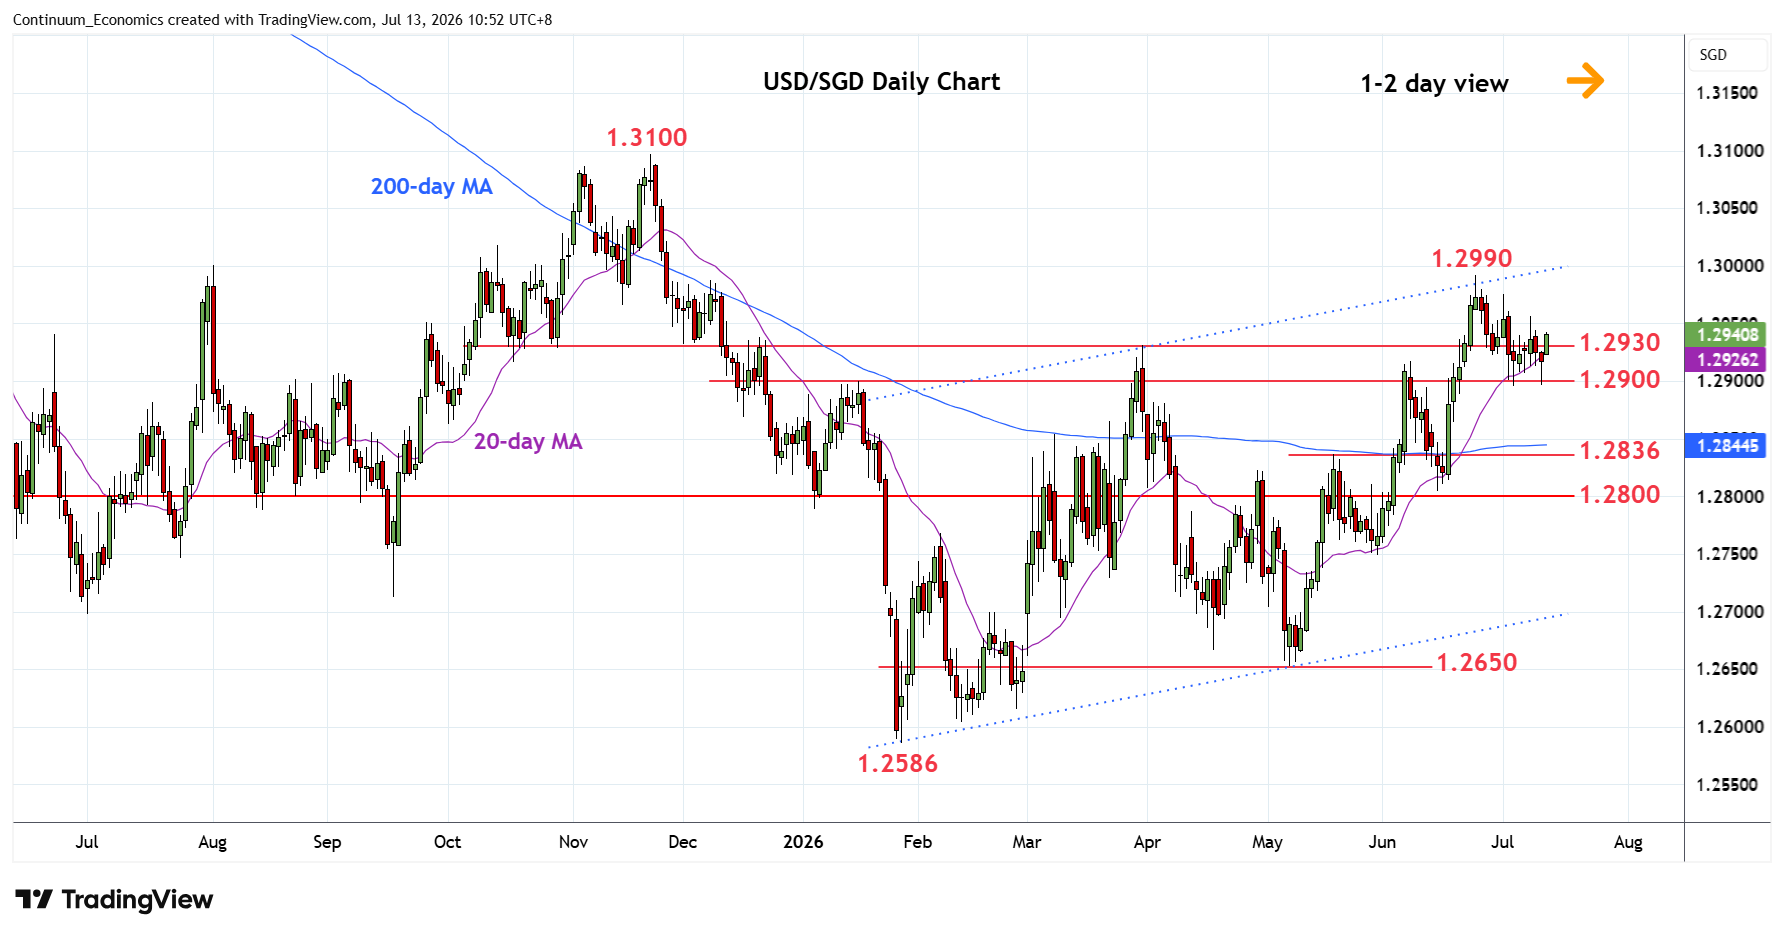
Higher at the open as prices extend Friday's bounce from the 1.2900 level
| Level | Comment | Level | Comment | ||||
|---|---|---|---|---|---|---|---|
| R4 | 1.3050 | * | congestion | S1 | 1.2900 | * | congestion |
| R3 | 1.3000 | ** | figure, congestion | S2 | 1.2850 | * | congestion |
| R2 | 1.2990 | ** | Jun YTD high | S3 | 1.2836 | ** | May high |
| R1 | 1.2950 | * | congestion | S4 | 1.2805/00 | ** | 15 Jun low, congestion |
Asterisk denotes strength of level
01:50 GMT - Higher at the open as prices extend Friday's bounce from the 1.2900 level as prices consolidate losses from the 1.2990 high to retest the 1.2930/50 resistance. This area is expected to cap and sustain losses from the 1.2990 high. Break here, if seen will further extend strong gains from the May swing lower and see room for extension to the 1.3000 figure and channel top from the January low. Meanwhile, support remains at the 1.2900 level. Would take break here to open up room for deeper pullback to retrace strong gains from the May swing low.