Published: 2026-10-13T02:31:05.000Z
Chart USD/SGD Update: Ranging around 1.2800
1
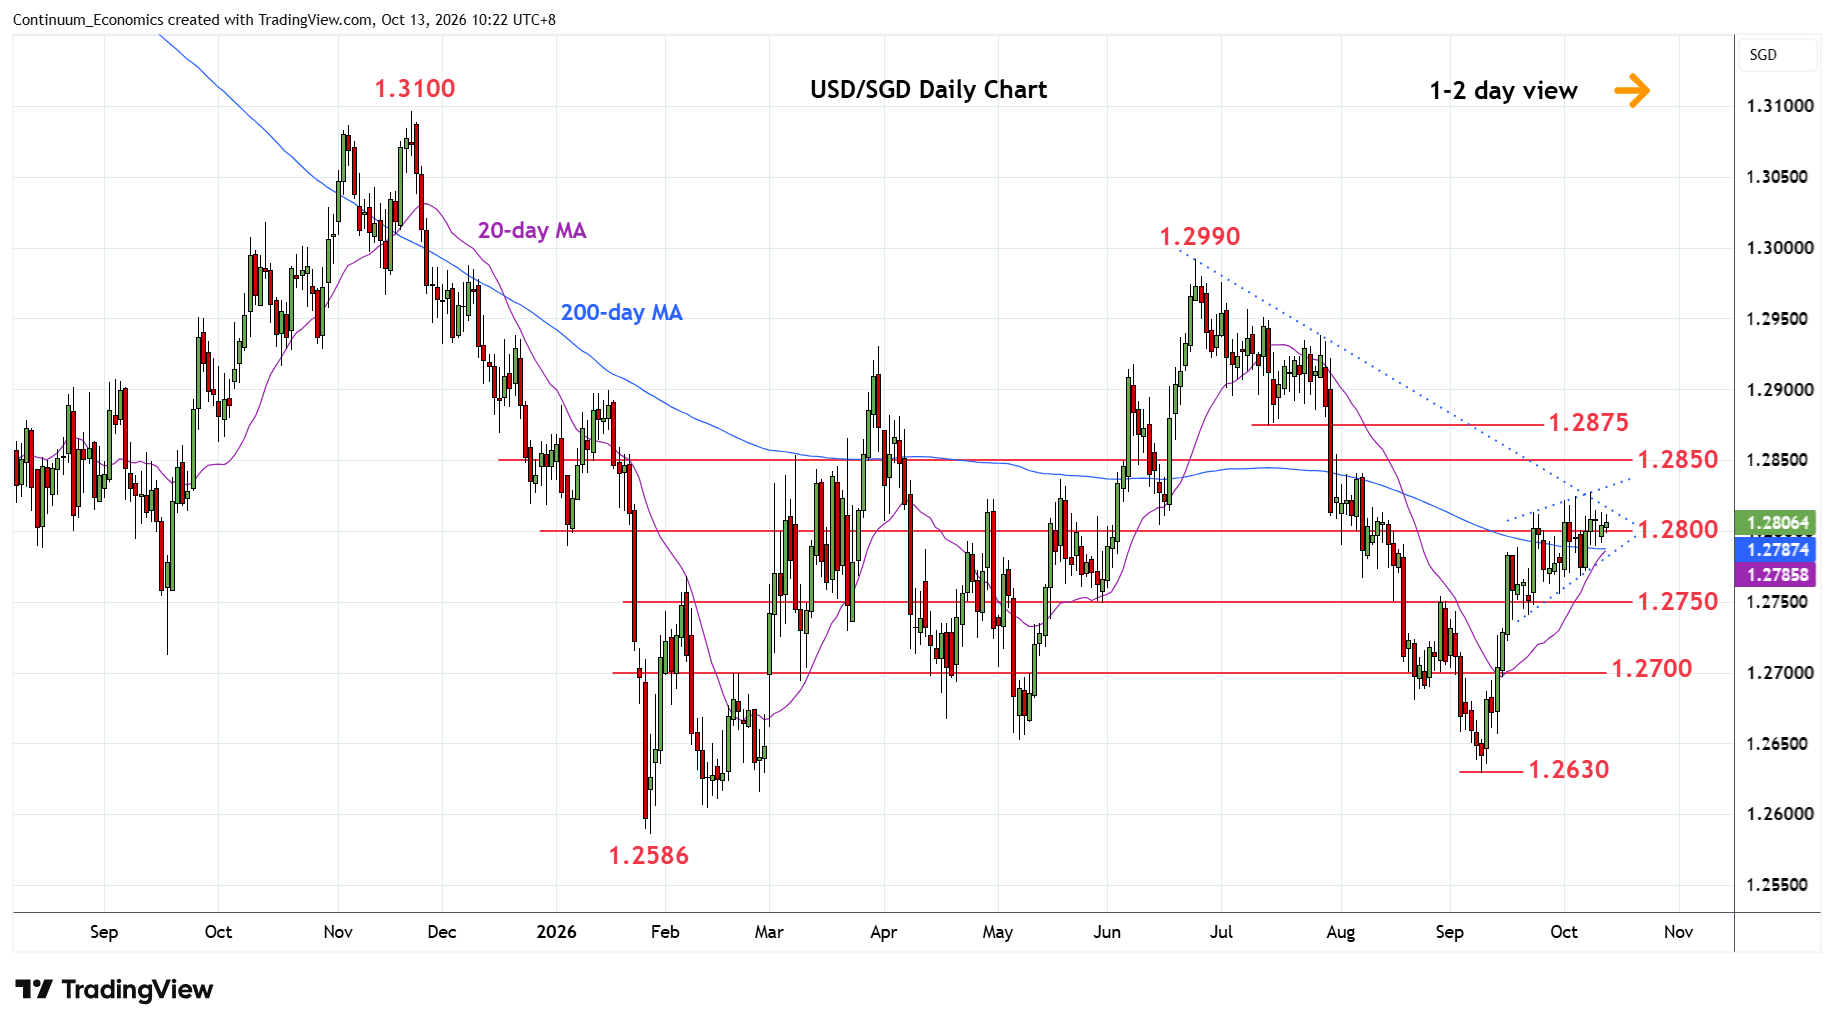
Little change, as prices extend consolidation around the 1.2800 level following gains from the 1.2750 support
| Level | Comment | Level | Comment | ||||
|---|---|---|---|---|---|---|---|
| R4 | 1.2900 | * | congestion | S1 | 1.2750/30 | * | congestion, 15 Sep high |
| R3 | 1.2875 | ** | 14 Jul low | S2 | 1.2700 | * | congestion, Jul 2025 yr low |
| R2 | 1.2850 | * | 61.8% Jun/Sep fall | S3 | 1.2680 | * | Aug low |
| R1 | 1.2825 | * | 8 Oct high | S4 | 1.2650 | ** | May low |
Asterisk denotes strength of level
02:25 GMT - Little change, as prices extend consolidation around the 1.2800 level following gains from the 1.2750 support. Rising wedge pattern from the 1.2750/30 area caution pullback to and break here will fade the upside pressure and confirm a top pattern at the 1.2825 high. Lower will see room for retest of strong support at the 1.2700/1.2680 area. Lower still, will return focus to 1.2650 and 1.2630, May/September lows. Meanwhile, resistance remains at 1.2825 high. Would take break here to further retrace the June/September losses towards strong resistance at 1.2850/75 area.