Published: 2026-10-27T06:15:18.000Z
Chart USD/TWD Update: Leaning lower from 32.700 current year high
1
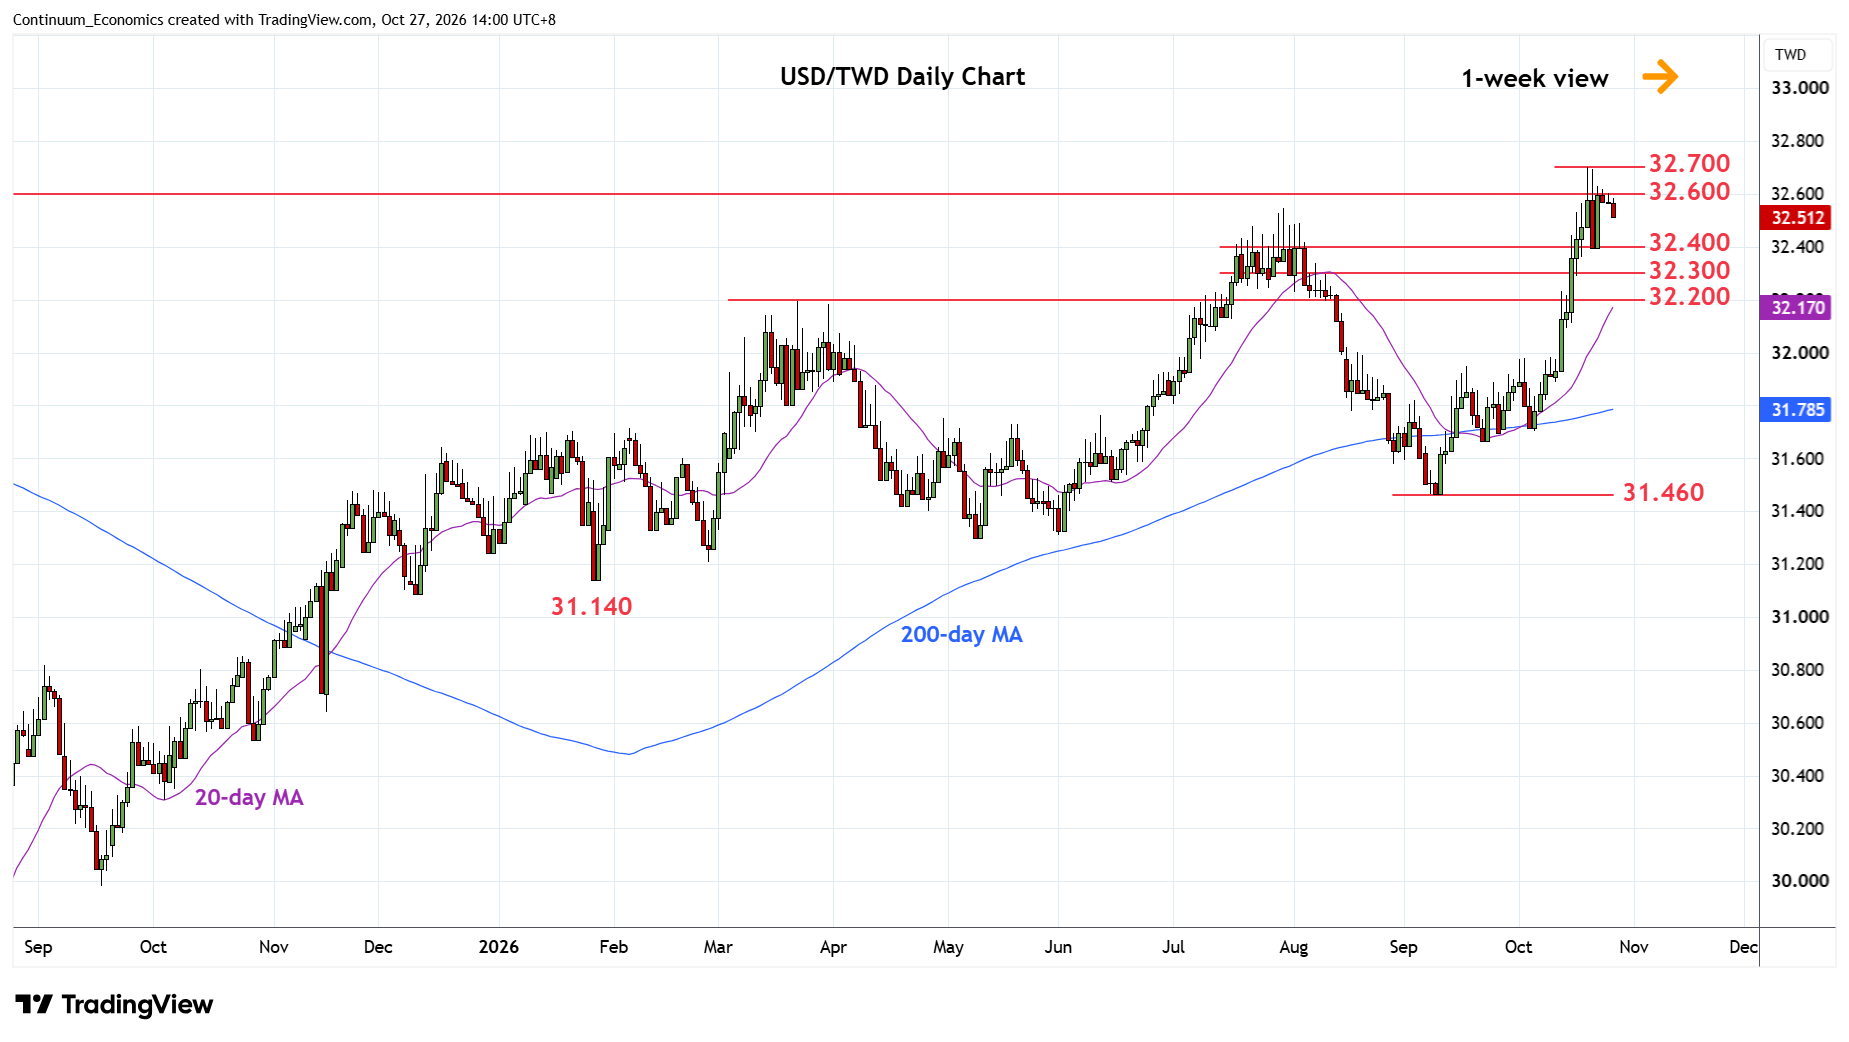
Break above the 32.550 July high last week saw gains reach fresh year high at the 32.700 level
| Levels | Imp | Comment | Levels | Imp | Comment | |||
|---|---|---|---|---|---|---|---|---|
| R4 | 33.000 | ** | Dec 2024 yr high | S1 | 32.500 | * | congestion | |
| R3 | 32.800 | * | congestion | S2 | 32.400 | * | congestion | |
| R2 | 32.700 | ** | 20 Oct YTD high | S3 | 32.300 | * | congestion | |
| R1 | 32.600 | * | congestion | S4 | 32.200 | ** | congestion, Mar high |
06:10 GMT - Break above the 32.550 July high last week saw gains reach fresh year high at the 32.700 level. Rejection from the latter see prices consolidating strong gains from the 31.460 low of September and unwinding overbought daily studies. Support is at the 32.500/32.400 congestion and see break here needed to open up room to the 32.300 congestion then 32.200 March high which is expected to underpin. Break here, will turn focus lower to retrace the September/October rally to the 32.000 figure. Meanwhile, resistance at 32.600 congestion now expected to cap and sustain pullback from the 32.700 high.