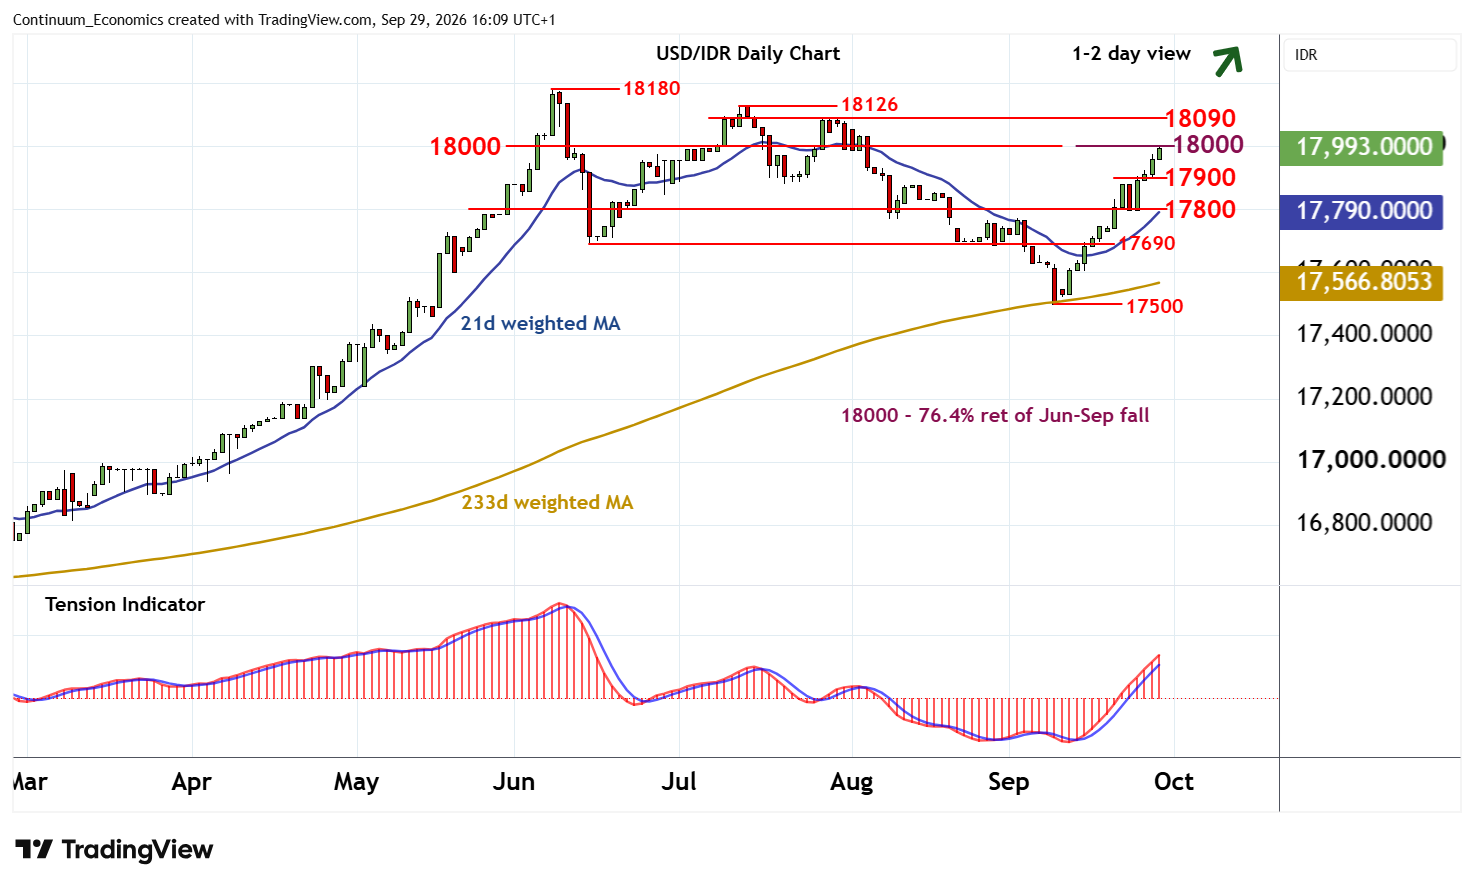
Chart USD/IDR Updates: Pressuring 18000 - daily studies overstretched
Anticipated gains reached strong resistance at 18000, where deteriorating intraday studies are prompting consolidation
| Levels | Imp | Comment | Levels | Imp | Comment | |||
|---|---|---|---|---|---|---|---|---|
| R4 | 18180 | ** | 8 Jun YTD high | S1 | 17900 | * | pivot | |
| R3 | 18126 | ** | 13 Jul (m) high | S2 | 17800 | * | congestion | |
| R2 | 18090 | * | 28 Jul high | S3 | 17690 | ** | Jun low | |
| R1 | 18000 | ** | cong; 76.4% ret | S4 | 17600 | * | congestion |
Asterisk denotes strength of level
16:05 BST - Anticipated gains reached strong resistance at 18000, where deteriorating intraday studies are prompting consolidation. A minor pullback towards support at 17900 is possible. But rising daily readings and improving weekly charts should prompt renewed buying interest towards here. A break, if seen, will turn sentiment cautious and give way to consolidation above congestion support at 17800.
Meanwhile, a break above 18000 will target the 18090 high of 28 July and the 18126 monthly high of 13 July. However, already overbought daily stochastics could limit any initial tests in profit-taking/consolidation, before September gains extend towards critical resistance at the 18180 current year high of 8 June.