Published: 2026-06-24T04:46:12.000Z
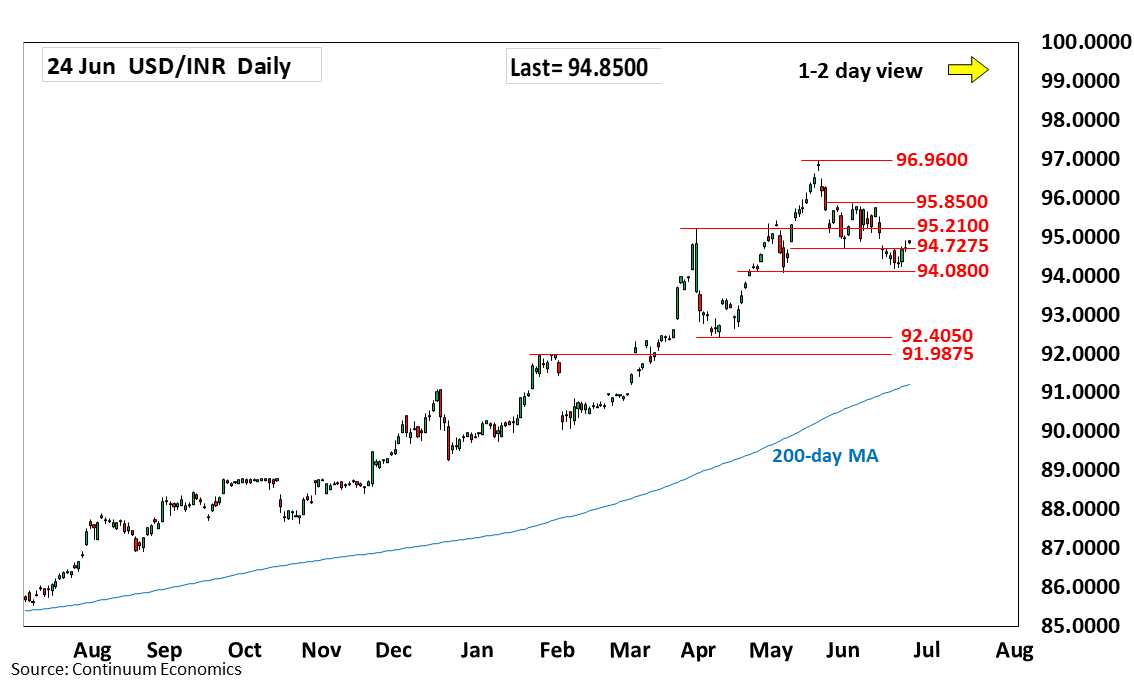
Chart USD/INR Update: Extending bounce from 94.1800 low
1
Extend bounce from the 94.1800 low as prices consolidate losses from the 95.8500 high and unwind oversold daily studies
| Level | Comment | Level | Comment | |||||
|---|---|---|---|---|---|---|---|---|
| R4 | 96.5000 | congestion | S1 | 94.7275 | * | 1 Jun low | ||
| R3 | 96.0000 | * | figure | S2 | 94.1800 | * | 18 Jun low | |
| R2 | 95.8500 | ** | 3 Jun high | S3 | 94.0800 | ** | May low | |
| R1 | 95.2100 | ** | Mar high | S4 | 93.4100 | ** | 15 Apr high |
Asterisk denotes strength of level
04:45 GMT - Extend bounce from the 94.1800 low as prices consolidate losses from the 95.8500 high and unwind oversold daily studies. However, this is expected to give way to renewed selling pressure later. Below 94.1800 will see room to strong support at the 94.0800/94.0000 area. Break here will extend losses from the 96.9600 May all-time high to support at 93.4100 then the 93.0000 figure. Meanwhile, break above the 94.7275 resistance opens up room for stronger bounce to the 95.2100 March high which is expected to cap.