Published: 2026-06-19T06:24:33.000Z
Chart USD/CNH Update: Extend bounce from 6.7540 low
1
Bounce from the 6.7540 low has seen break above the 6.7800 resistance and 2-month wedge pattern
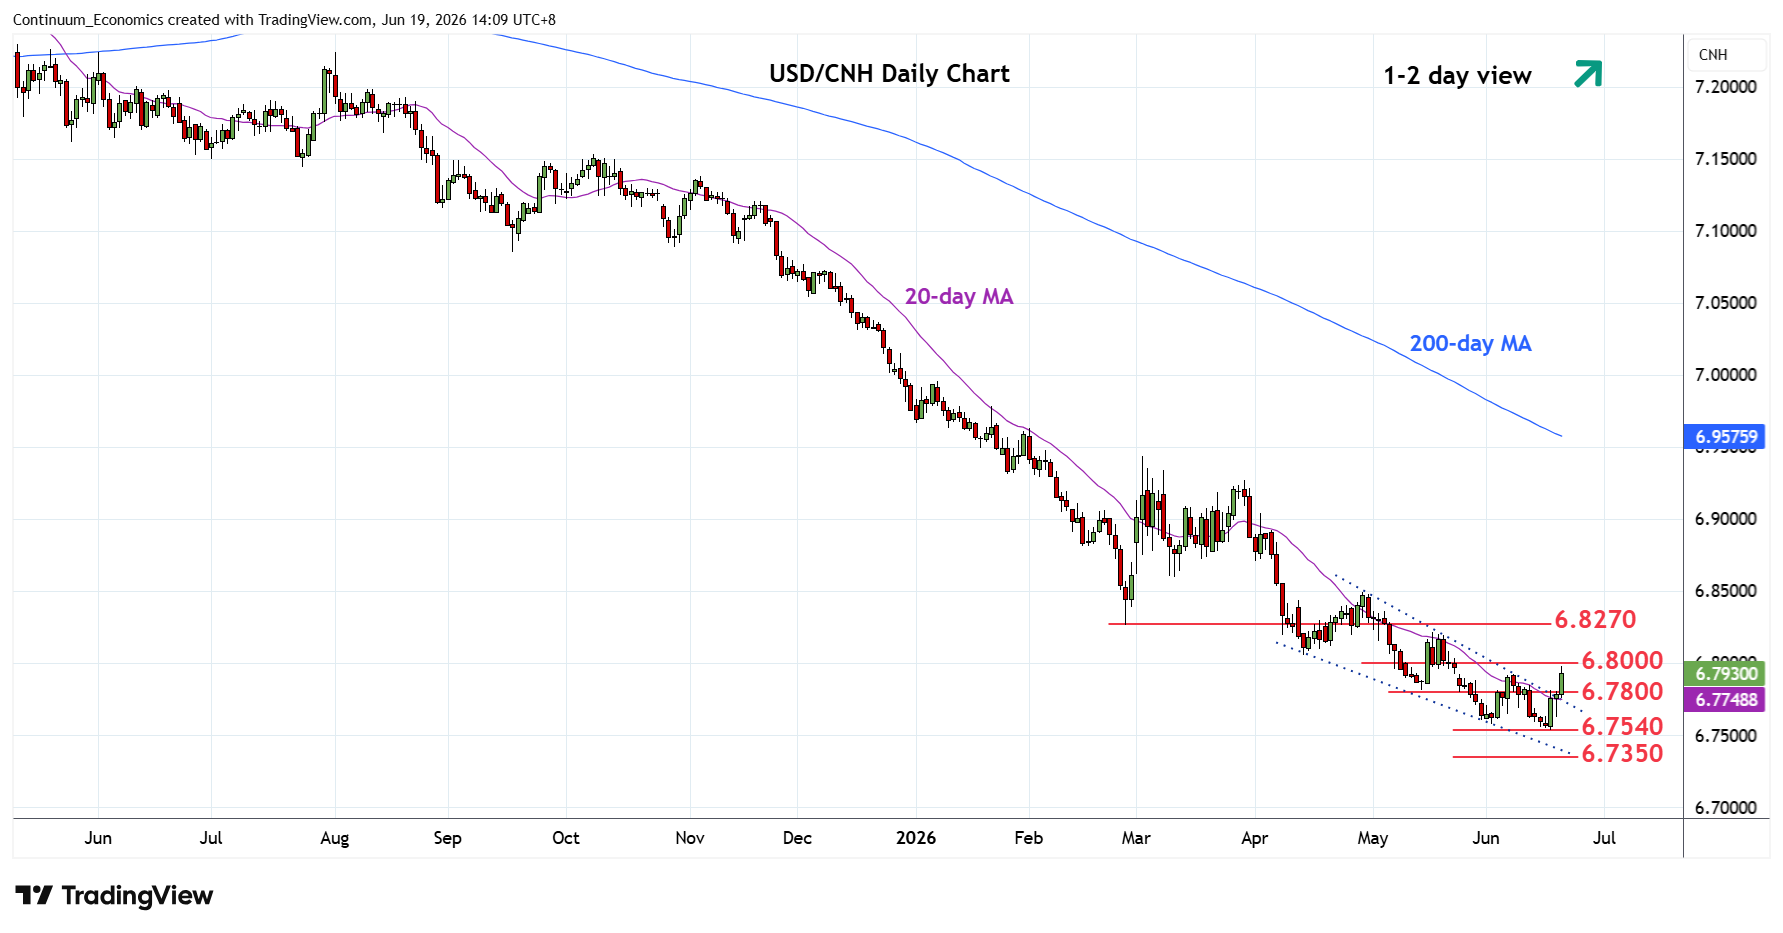
| Level | Imp | Comment | Level | Imp | Comment | |||
|---|---|---|---|---|---|---|---|---|
| R4 | 6.8600 | * | Mar low | S1 | 6.7800 | * | congestion | |
| R3 | 6.8500 | * | 29 Apr high | S2 | 6.7540 | ** | 17 Jun YTD low | |
| R2 | 6.8200/70 | ** | congestion, Feb low | S3 | 6.7350 | * | 61.8% 2022/2025 rally | |
| R1 | 6.8000/60 | * | congestion, Apr low | S4 | 6.7200 | congestion |
Asterisk denotes strength of level
05:40 GMT - Bounce from the 6.7540 low has seen break above the 6.7800 resistance and 2-month wedge pattern. Prices are unwinding oversold daily and weekly studies and suggest scope for stronger bounce here to retrace losses from the 6.9300/6.9400 March highs to the 6.8000/60 area. Higher still, if seen, will see room to strong resistance at 6.8200/70 area. Meanwhile, support is raised to the 6.7800 congestion which is expected to underpin. Break here will expose the 6.7540 low to retest and extend losses from April 2025 high.