Published: 2026-06-04T06:28:35.000Z
Chart USD/CNH Update: Consolidating
2
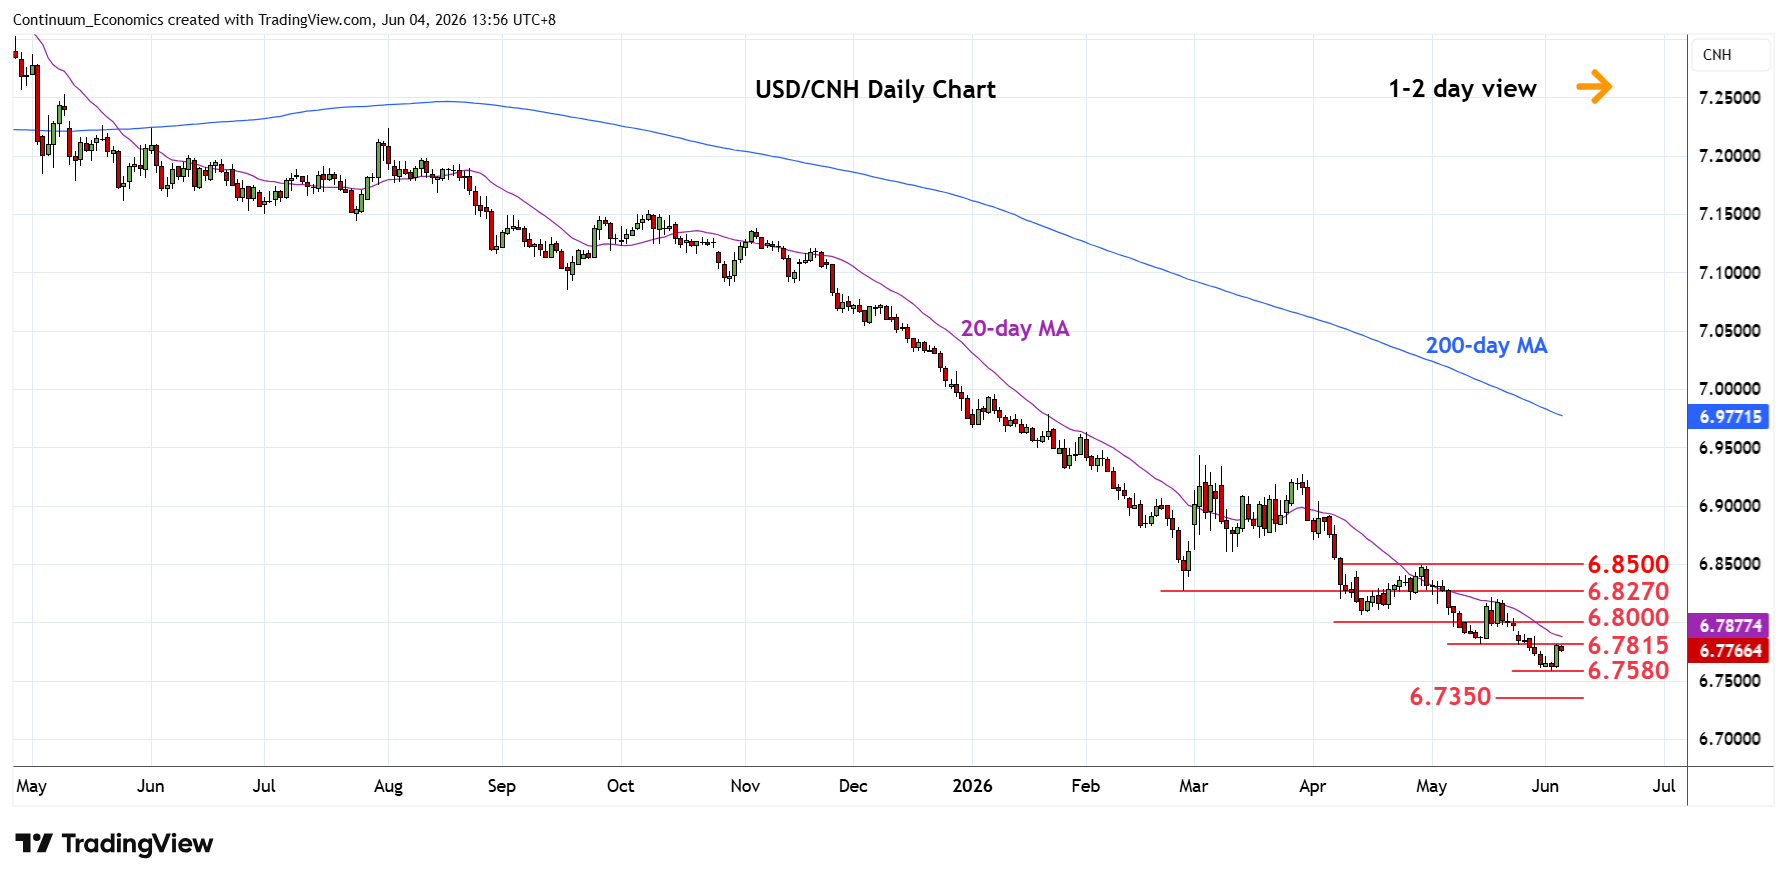
Turned up from fresh year low at 6.7580 as prices consolidate recent losses and unwind oversold daily studies
| Level | Imp | Comment | Level | Imp | Comment | |||
|---|---|---|---|---|---|---|---|---|
| R4 | 6.85000 | ** | 29 Apr high, congestion | S1 | 6.7580 | ** | 2 Jun YTD low | |
| R3 | 6.8200/70 | ** | congestion, Feb low | S2 | 6.7500 | * | congestion | |
| R2 | 6.8000/60 | * | congestion, Apr low | S3 | 6.7350 | * | 61.8% 2022/2025 rally | |
| R1 | 6.7815 | * | 14 May low | S4 | 6.7200 | congestion |
Asterisk denotes strength of level
06:20 GMT - Turned up from fresh year low at 6.7580 as prices consolidate recent losses and unwind oversold daily studies to reach resistance at 6.7815, low of 14 May. Would take break here to open up room for stronger correction to 6.8000/60 congestion and April low. Higher still, if seen, will see scope to strong resistance at 6.8270 February which is expected to cap. Correction expected to give way to renewed selling pressure later. Below 6.7580 will see room for extension to support at the 6.7500 level and the 6.7350, 61.8% Fibonacci retracement.