Published: 2026-08-17T16:42:38.000Z
Chart USD/MXN Update: Fresh year lows - studies remain under pressure
3
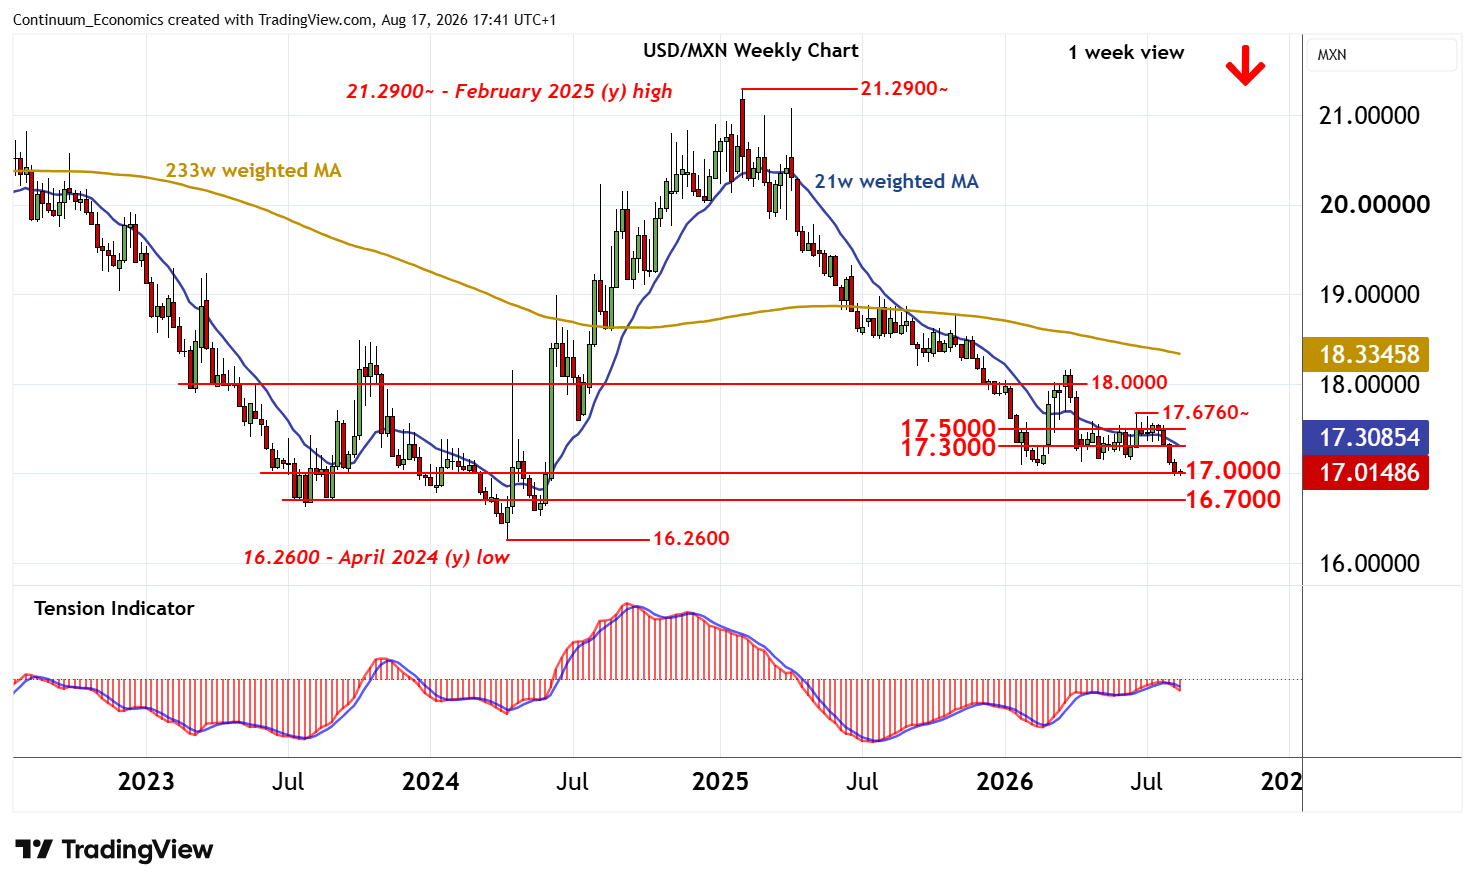
Anticipated losses have posted a fresh year low around congestion support at 17.0000
| Levels | Imp | Comment | Levels | Imp | Comment | |||
|---|---|---|---|---|---|---|---|---|
| R4 | 17.8500 | * | congestion | S1 | 17.0000 | ** | congestion | |
| R3 | 17.6000 | ** | congestion | S2 | 16.7000 | * | congestion | |
| R2 | 17.5000 | ** | congestion | S3 | 16.5275 | * | May 2024 low | |
| R1 | 17.3000 | * | break level | S4 | 16.2600 | ** | April 2024 (y) low |
Asterisk denotes strength of level
16:50 BST - Anticipated losses have posted a fresh year low around congestion support at 17.0000, where flat oversold daily stochastics are prompting short-term reactions. However, the daily Tension Indicator continues to track lower and weekly charts are bearish, highlighting room for further losses in the coming sessions. A close beneath here will add weight to sentiment and extend February 2025 losses initially towards congestion around 16.7000.
Meanwhile, resistance remains at 17.3000. A close above here, if seen, would help to stabilise price action and give way to fresh consolidation beneath 17.5000.