Published: 2026-08-17T02:43:07.000Z
Chart USD/SGD Update: Leaning lower
2
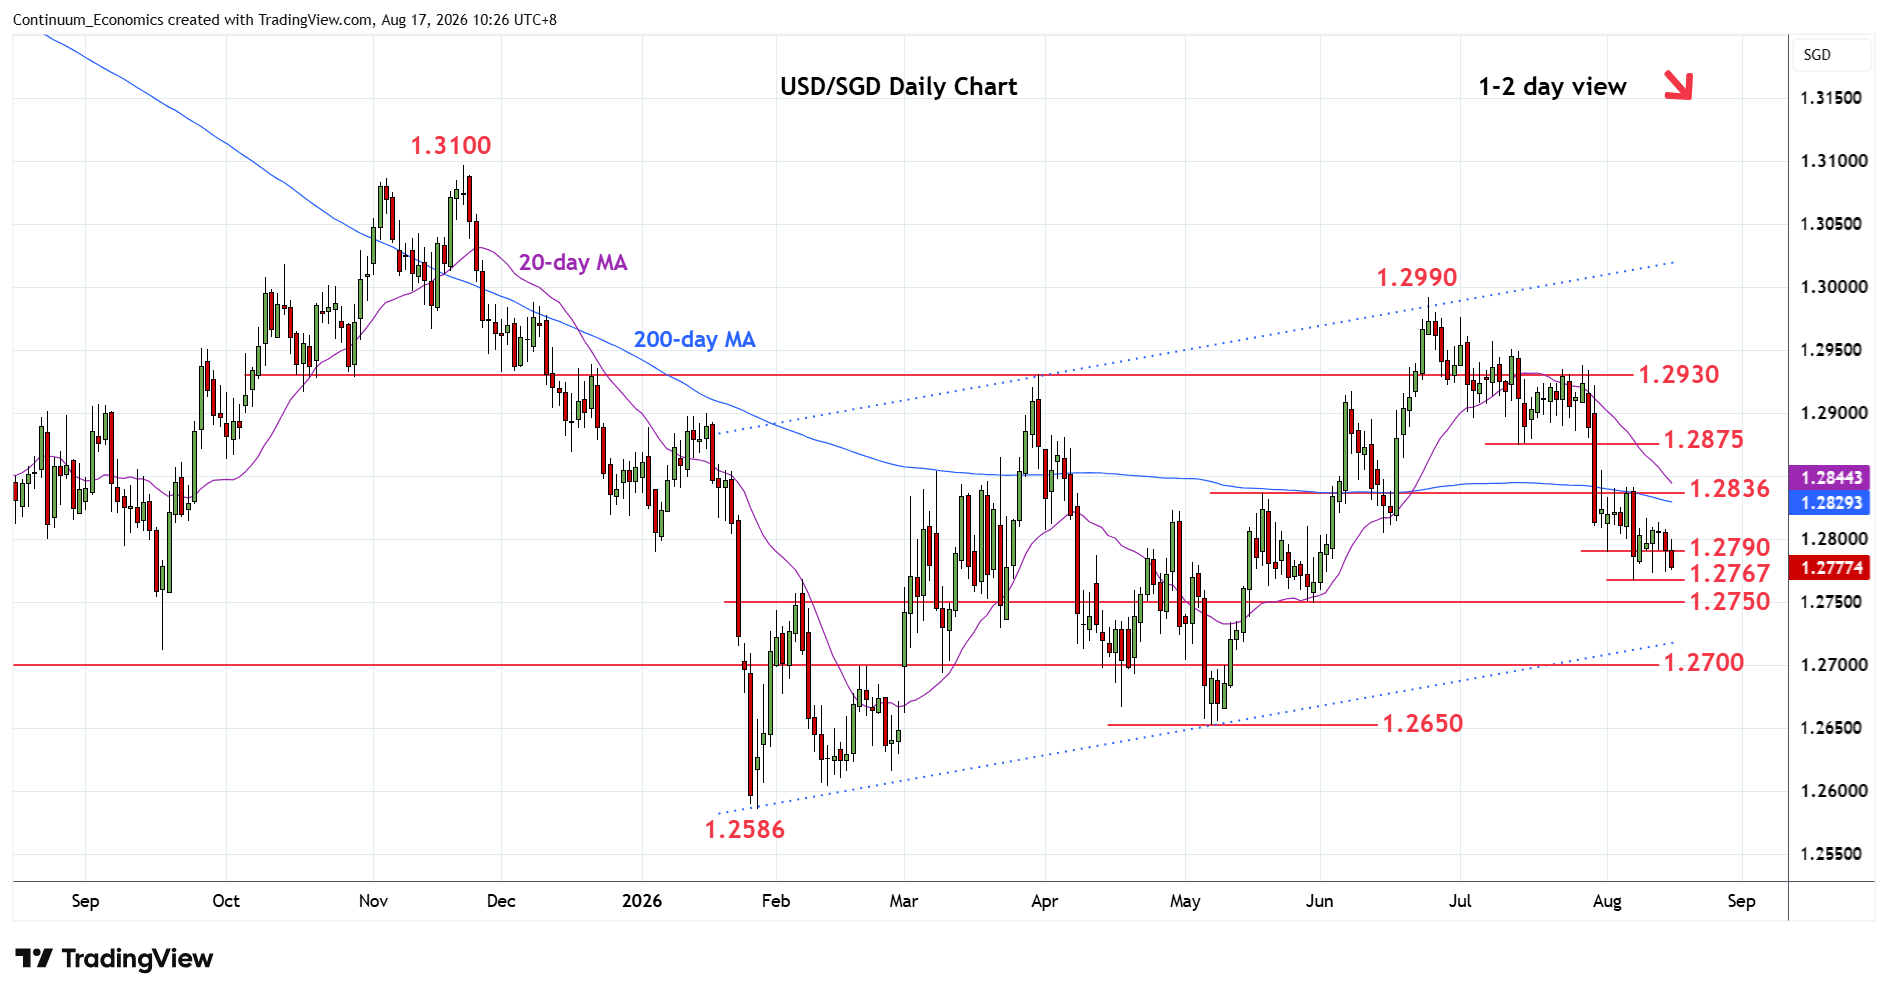
Leaning lower as consolidation at the 1.2800 level turn back towards the 1.2767 low
| Level | Comment | Level | Comment | ||||
|---|---|---|---|---|---|---|---|
| R4 | 1.2875 | ** | 14 Jul low | S1 | 1.2767 | ** | 7 Aug low |
| R3 | 1.2850 | * | congestion | S2 | 1.2750 | * | congestion |
| R2 | 1.2836 | ** | May high | S3 | 1.2700 | ** | congestion, 2025 yr low |
| R1 | 1.2800 | congestion | S4 | 1.2650 | ** | May low |
Asterisk denotes strength of level
02:30 GMT - Leaning lower as consolidation at the 1.2800 level turn back towards the 1.2767 low. Daily and weekly studies are tracking lowe and suggest scope for break here to extend losses from the June current year high at 1.2990 to further retrace the May/June rally toward 1.2750 congestion. Below this will turn focus to strong support at the 1.2700 congestion and 2025 year low. Meanwhile, resistance is lowered to the 1.2800 level and extending to the 1.2836 May high which is expected to cap and sustain losses from the 1.2990 high.