Published: 2026-06-11T04:52:40.000Z
Chart USD/INR Update: Higher in consolidation above 94.7275 low
1
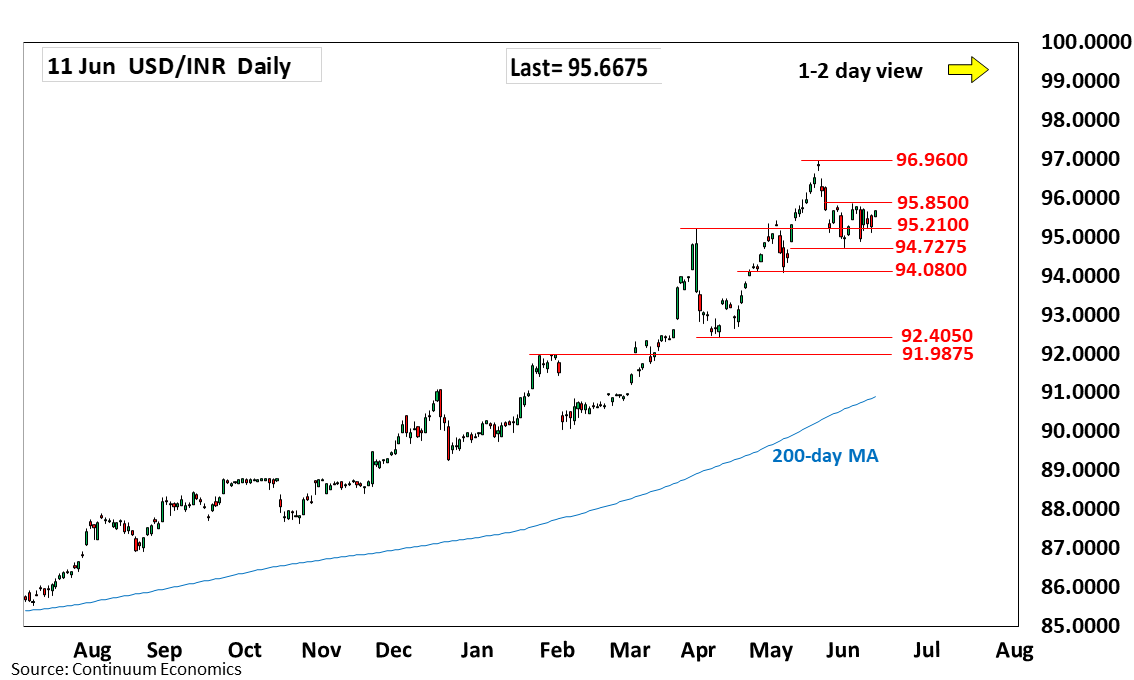
Higher in consolidation and bounce above the 95.2100 support sets up scope for retest of resistance at the 95.8500, 3 June high
| Level | Comment | Level | Comment | |||||
|---|---|---|---|---|---|---|---|---|
| R4 | 97.1000 | projection | S1 | 95.2100 | * | Mar high | ||
| R3 | 96.9600 | ** | 20 May all-time high | S2 | 94.7275 | ** | 1 Jun low | |
| R2 | 96.0000 | * | figure | S3 | 94.0800 | ** | May low | |
| R1 | 95.8500 | ** | 3 Jun high | S4 | 93.4100 | ** | 15 Apr high |
Asterisk denotes strength of level
04:50 GMT - Higher in consolidation and bounce above the 95.2100 support sets up scope for retest of resistance at the 95.8500, 3 June high. While the latter caps, scope is seen for pullback to retest the 94.7275 low. Would take break here to open up room for deeper pullback to retrace gains from the April low to strong support at the 94.0800/94.0000 area. Lower still, will see room to 93.4100 support and the 93.0000 figure. Meanwhile, break above the 95.7925/95.8500 highs will see room to the 96.0000 figure then the 96.9600 all-time high.