Published: 2026-08-19T03:17:36.000Z
Chart USD/MYR Update: Consolidating, room for lower later
2
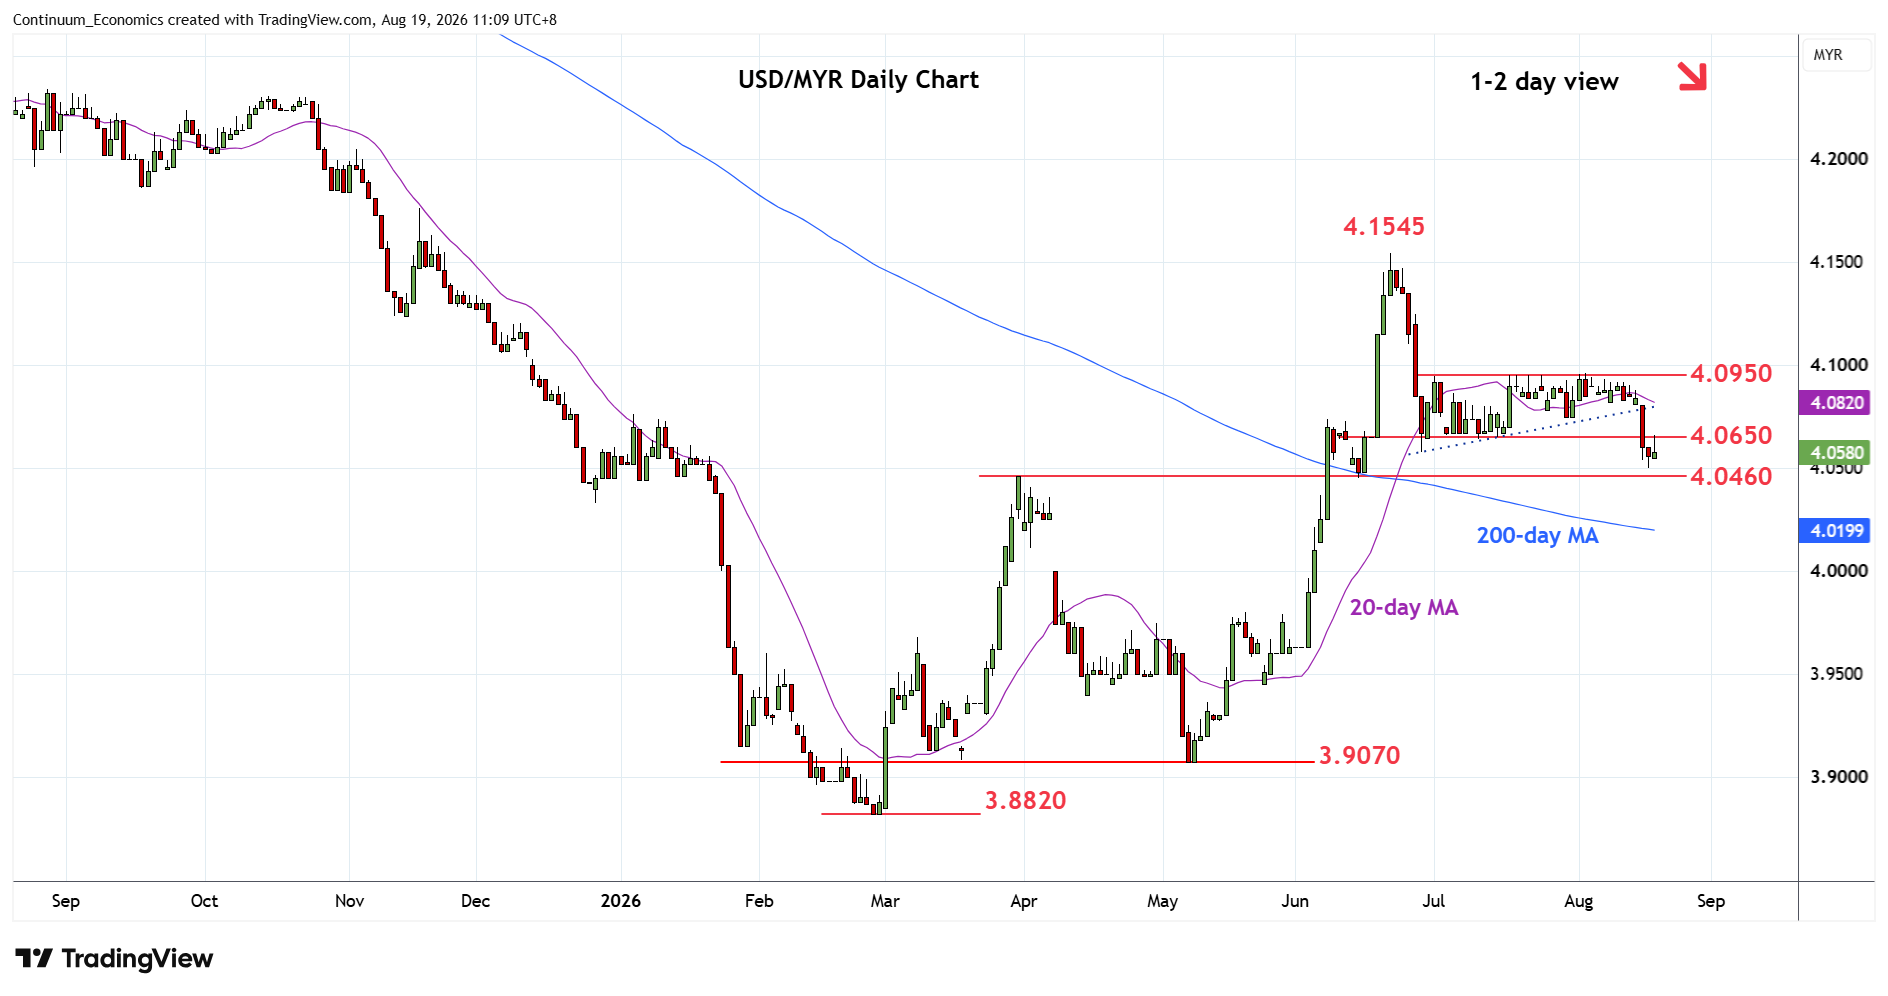
Steadied at 4.0500 low as prices unwind oversold intraday studies but shallow bounce keep pressure on the downside
| Levels | Imp | Comment | Levels | Imp | Comment | |||
|---|---|---|---|---|---|---|---|---|
| R4 | 4.0950 | ** | Jul high | S1 | 4.0460 | ** | Mar high | |
| R3 | 4.0800 | * | congestion | S2 | 4.0300 | * | 50% May/Jun rally | |
| R2 | 4.0750 | * | 30 Jul low | S3 | 4.0000 | ** | figure, 61.8% | |
| R1 | 4.0650 | ** | congestion | S4 | 3.9800 | ** | May high |
Asterisk denotes strength of level
03:15 GMT - Steadied at 4.0500 low as prices unwind oversold intraday studies but shallow bounce keep pressure on the downside. Lower will see room to extend losses from the 4.1545 June current year high retrace rally from the 3.9070, May low. Break of strong support at 4.0460 March high will see room to 4.0300, 50% Fibonacci retracement. Lower still, will see scope to 4.0000 figure and 61.8% Fibonacci level. Meanwhile, the 4.0650/4.0750 recent July lows now turned resistance is expected to cap corrective bounce and sustain losses from 4.0950 congestion.