Published: 2026-11-10T02:35:12.000Z
Chart USD/MYR Update: Consolidation to give way to selling pressure later
1
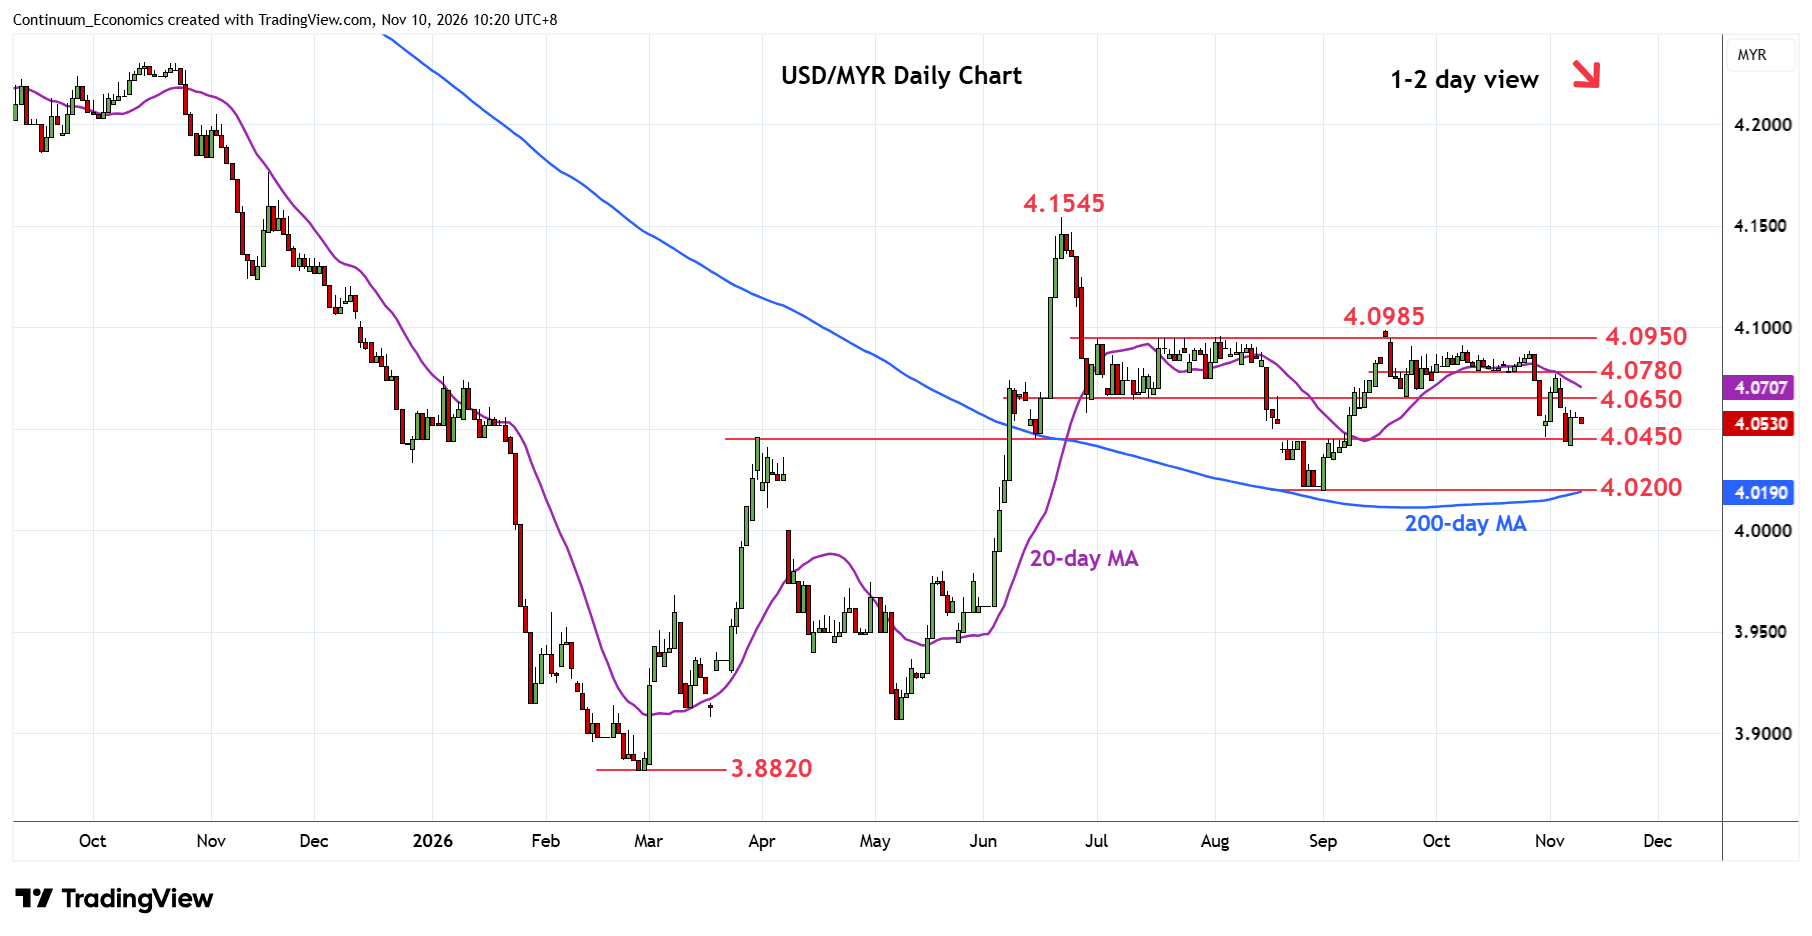
Turned up from the 4.0420 Friday's low as prices consolidate losses from the 4.0885 late-October high
| Levels | Imp | Comment | Levels | Imp | Comment | |||
|---|---|---|---|---|---|---|---|---|
| R4 | 4.0915 | * | 8 Oct high | S1 | 4.0420 | * | 6 Nov low | |
| R3 | 4.0885 | * | 27 Oct high | S2 | 4.0200 | ** | Sep low | |
| R2 | 4.0780 | ** | 21 Oct low | S3 | 4.0000 | * | figure, congestion | |
| R1 | 4.0650 | ** | congesion, 23 Sep low | S4 | 3.9800 | ** | May high |
Asterisk denotes strength of level
02:30 GMT - Turned up from the 4.0420 Friday's low as prices consolidate losses from the 4.0885 late-October high. However, negative daily and weekly studies suggest consolidation giving way to renewed selling pressure later to extend losses from the 4.0985 September high. Lower will see room for retest of the 4.0200 low where break will extend to broader losses from the 4.1545, June high. Meanwhile, resistance at the 4.0600/4.0650 congestion area is expected to cap and sustain losses from the 4.0950/4.0985 congestion and September high.