Chart USD/CNH Update: Limited downside tests
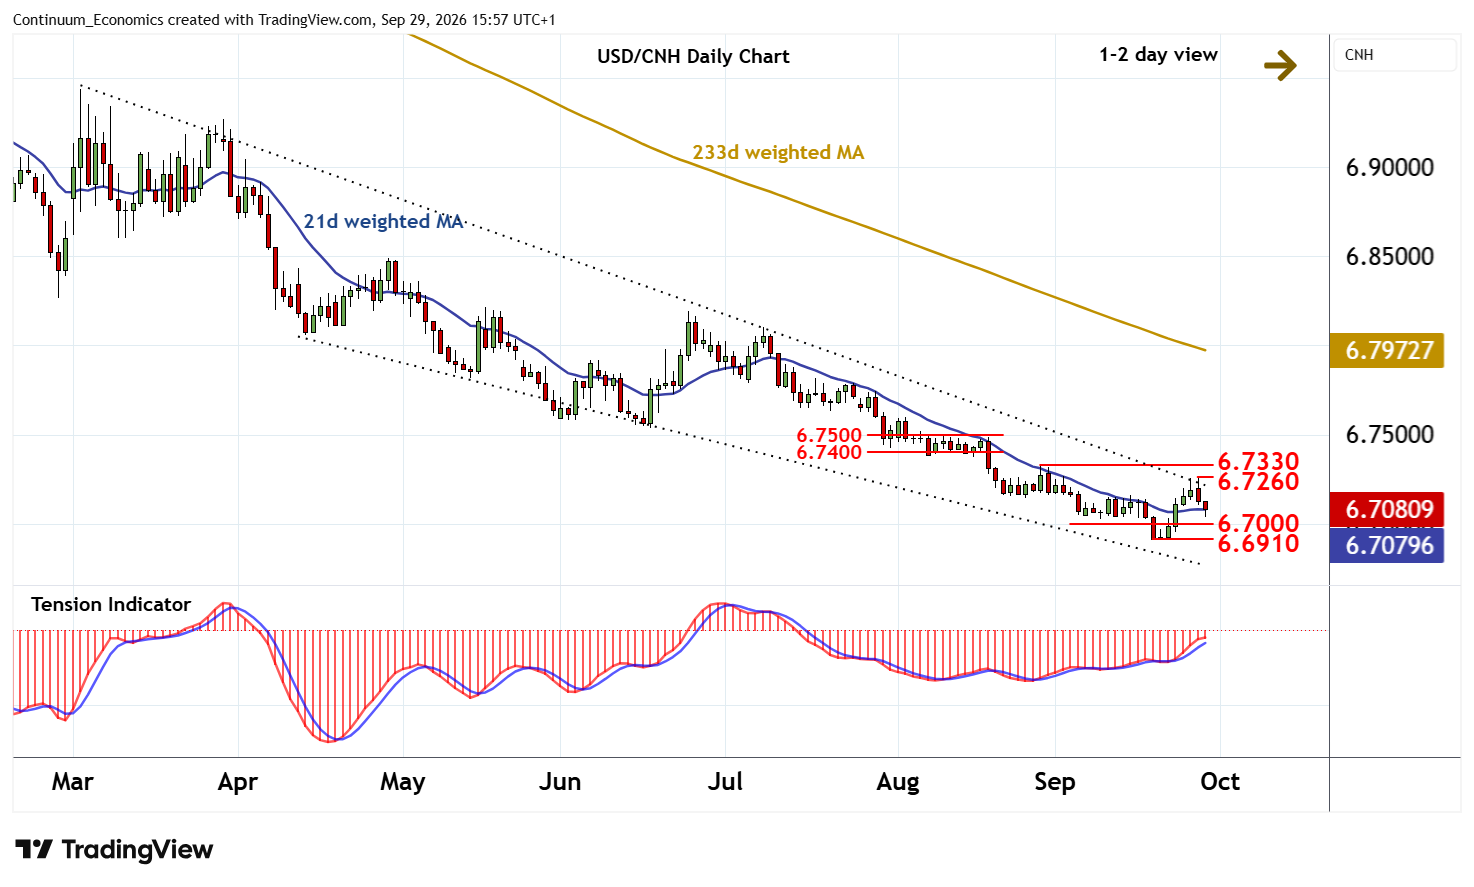
The anticipated test below 6.7100 has bounced from 6.7035
| Level | Imp | Comment | Level | Imp | Comment | |||
|---|---|---|---|---|---|---|---|---|
| R4 | 6.7500 | ** | range highs, break level | S1 | 6.7000 | * | congestion | |
| R3 | 6.7400 | * | 7 Aug low, congestion | S2 | 6.6910 | ** | 21 Sep YTD low | |
| R2 | 6.7330 | * | 28 Aug (w) high | S3 | 6.6700 | ** | 2023 year low | |
| R1 | 6.7260 | * | 28 Sep high | S4 | 6.6500 | * | congestion |
Asterisk denotes strength of level
15:05 BST - The anticipated test below 6.7100 has bounced from 6.7035, as oversold intraday studies turn higher, with prices currently balanced around 6.7080. Overbought daily stochastics are unwinding and the positive daily Tension Indicator is flattening, suggesting room for a test of congestion support at 6.7000. However, improving weekly charts should limit any break beneath here in renewed buying interest/consolidation above critical support at the 6.6910 current year low 21 September. A close beneath here, if seen, will turn sentiment negative and extend broad losses towards the 6.6700 low of 2023.
Following cautious/corrective trade, further gains are looked for. Resistance is at the 6.7260 high of 28 September. A close above here will improve sentiment and extend near-term gains beyond the 6.7330 weekly high of 28 August towards congestion within the 6.7400 - 6.7500 range.