Published: 2026-05-18T16:28:14.000Z
Chart USD/BRL Update: Consolidating sharp bounce from fresh year lows
3
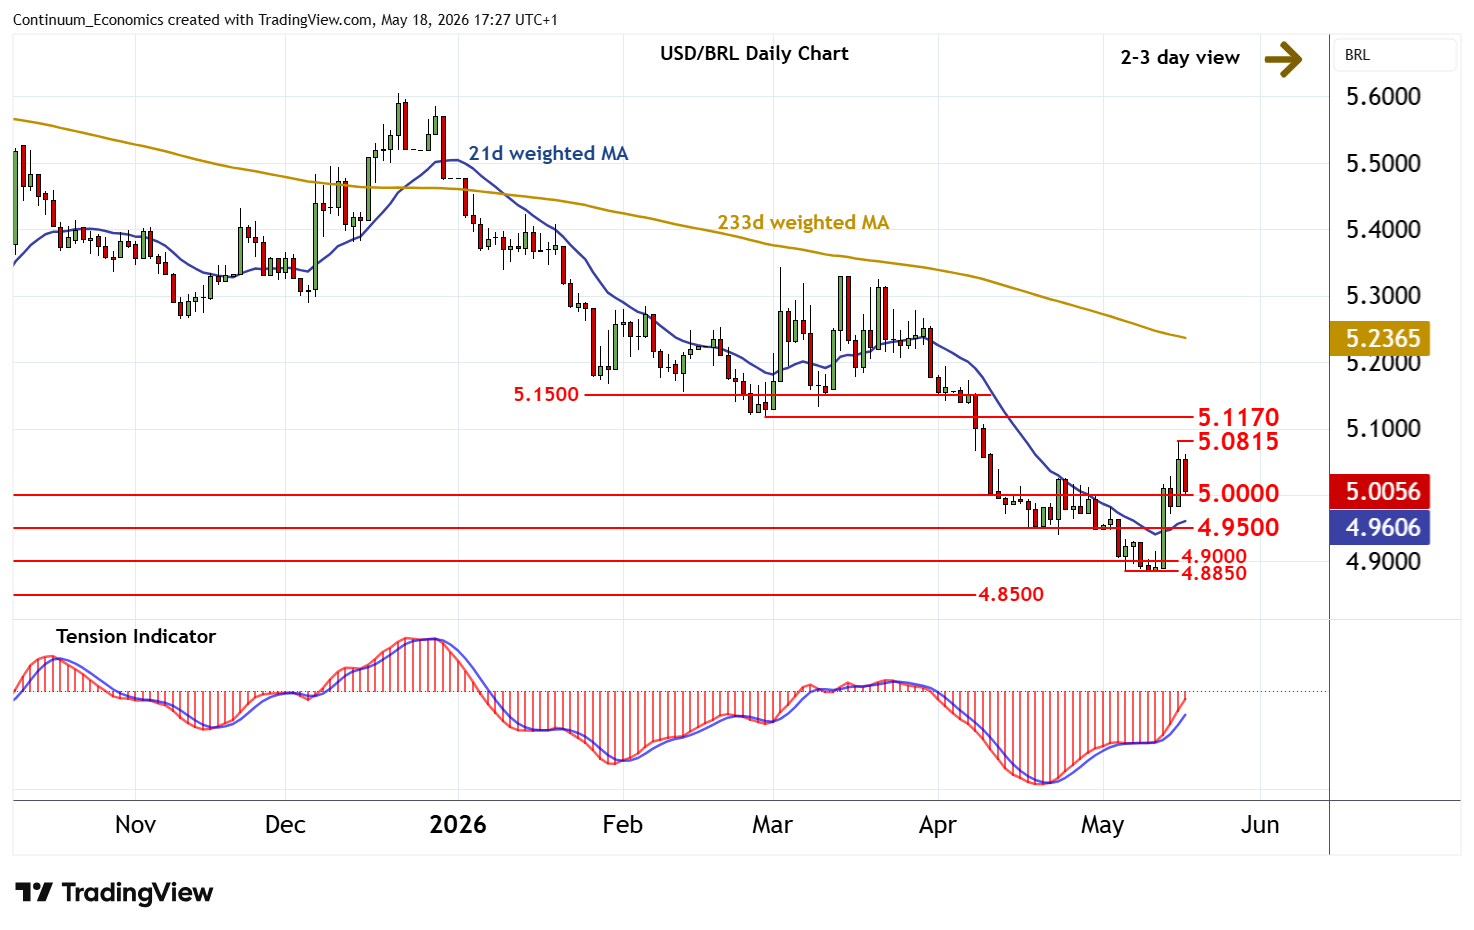
Anticipated losses have posted a fresh year low around 4.8850
| Levels | Imp | Comment | Levels | Imp | Comment | |||
|---|---|---|---|---|---|---|---|---|
| R4 | 5.2000 | ** | congestion | S1 | 5.0000 | ** | congestion | |
| R3 | 5.1500 | * | congestion | S2 | 4.9500 | ** | congestion | |
| R2 | 5.1170 | ** | 25 Feb (m) low | S3 | 4.9000 | ** | congestion | |
| R1 | 5.0815 | 15 May (w) high | S4 | 4.8850 | ** | 6-11 May YTD lows |
Asterisk denotes strength of level
17:00 BST - Anticipated losses have posted a fresh year low around 4.8850, before bouncing sharply to 5.0815, before settling back to 5.0000. A test beneath here is possible, as intraday studies turn down. But rising daily readings and improving weekly charts should limit scope in renewed buying interest/consolidation above congestion around 4.9500. Following cautious trade, fresh gains are looked for. However, a close above the 5.0815 weekly high of 15 May is needed to turn sentiment positive and open up a test of resistance within the 5.1170 - 5.1500 range.