Chart USD/CNH Update: Leaning lower
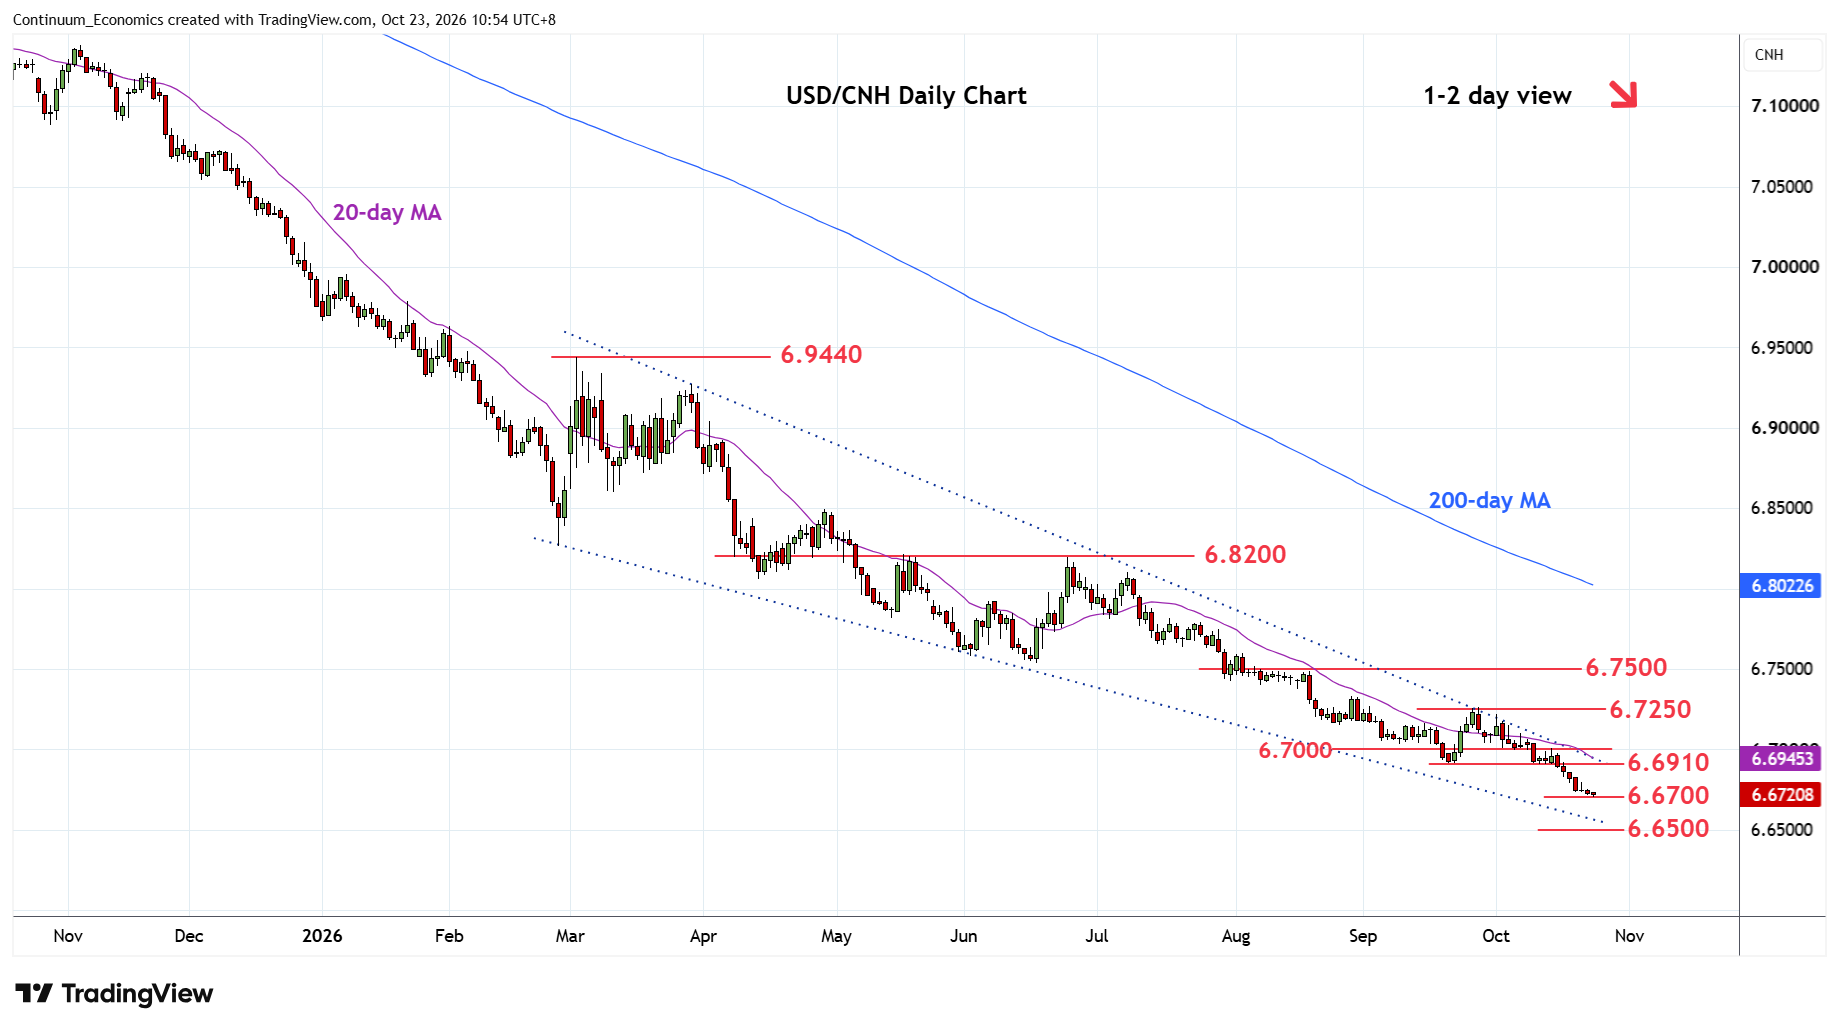
Pressure remains on the downside but bearish momentum slows as prices extend deep into oversold areas on intraday and daily chart
| Level | Imp | Comment | Level | Imp | Comment | |||
|---|---|---|---|---|---|---|---|---|
| R4 | 6.7400 | * | 7 Aug low, congestion | S1 | 6.6700 | ** | 2023 year low | |
| R3 | 6.7250 | * | congestion | S2 | 6.6500 | * | congestion | |
| R2 | 6.7000 | * | figure | S3 | 6.6160 | * | Jun 2022 low | |
| R1 | 6.6910 | ** | Sep low | S4 | 6.6000 | ** | figure |
Asterisk denotes strength of level
03:00 GMT - Pressure remains on the downside but bearish momentum slows as prices extend deep into oversold areas on intraday and daily chart. Nearby see strong support at the 6.6700, 2023 year low. Break here will see room to extend losses from the April 2025 year high to the 6.6500 congestion. Weekly studies are stretched as well with bullish divergence warning of scope for corrective bounce. Meanwhile, resistance remains at the 6.6910 low of September and the 6.7000 level. Would take break here to ease the downside pressure and open up room for stronger corrective bounce to the 6.7200/6.7250 area.