Published: 2026-06-03T05:41:46.000Z
Chart USD/INR Update: Extend corrective bounce
1
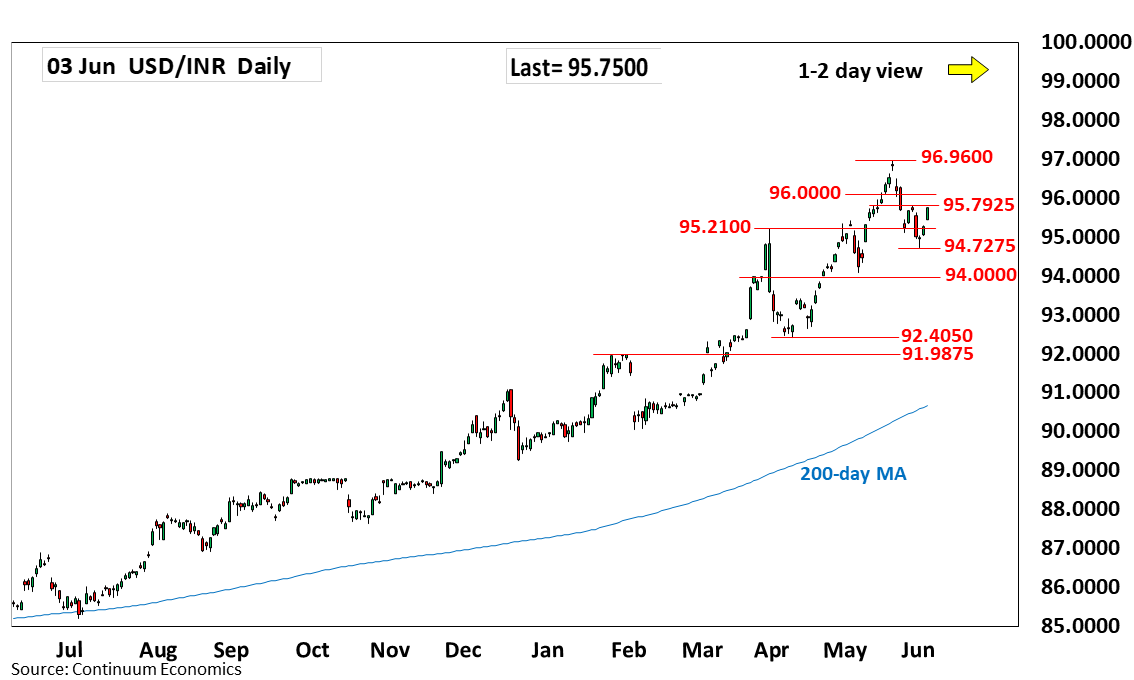
Sharply higher as prices extend bounce from the 94.7275 low to approach strong resistance at 95.7925, 27 May high
| Level | Comment | Level | Comment | |||||
|---|---|---|---|---|---|---|---|---|
| R4 | 97.1000 | projection | S1 | 95.2100 | * | Mar high | ||
| R3 | 96.9600 | ** | 20 May all-time high | S2 | 94.7275 | * | 1 Jun low | |
| R2 | 96.0000 | * | figure | S3 | 94.0800 | ** | May low | |
| R1 | 95.7925 | ** | 27 May high | S4 | 93.4100 | ** | 15 Apr high |
Asterisk denotes strength of level
05:35 GMT - Sharply higher as prices extend bounce from the 94.7275 low to approach strong resistance at 95.7925, 27 May high. Gains are seen corrective and see the latter and the 96.0000 figure expected to cap and give way to renewed selling pressure later. Break above the latter, if seen, will revive upside focus and sets up scope for retest of the 96.9600 high. Meanwhile, support is raised to the 95.2100 March high ahead of the 94.7275 low. Below these will see room for extension to strong support at 94.0800/94.0000, May low and congestion area.