Published: 2026-08-03T02:51:05.000Z
Chart USD/SGD Update: Under pressure
2
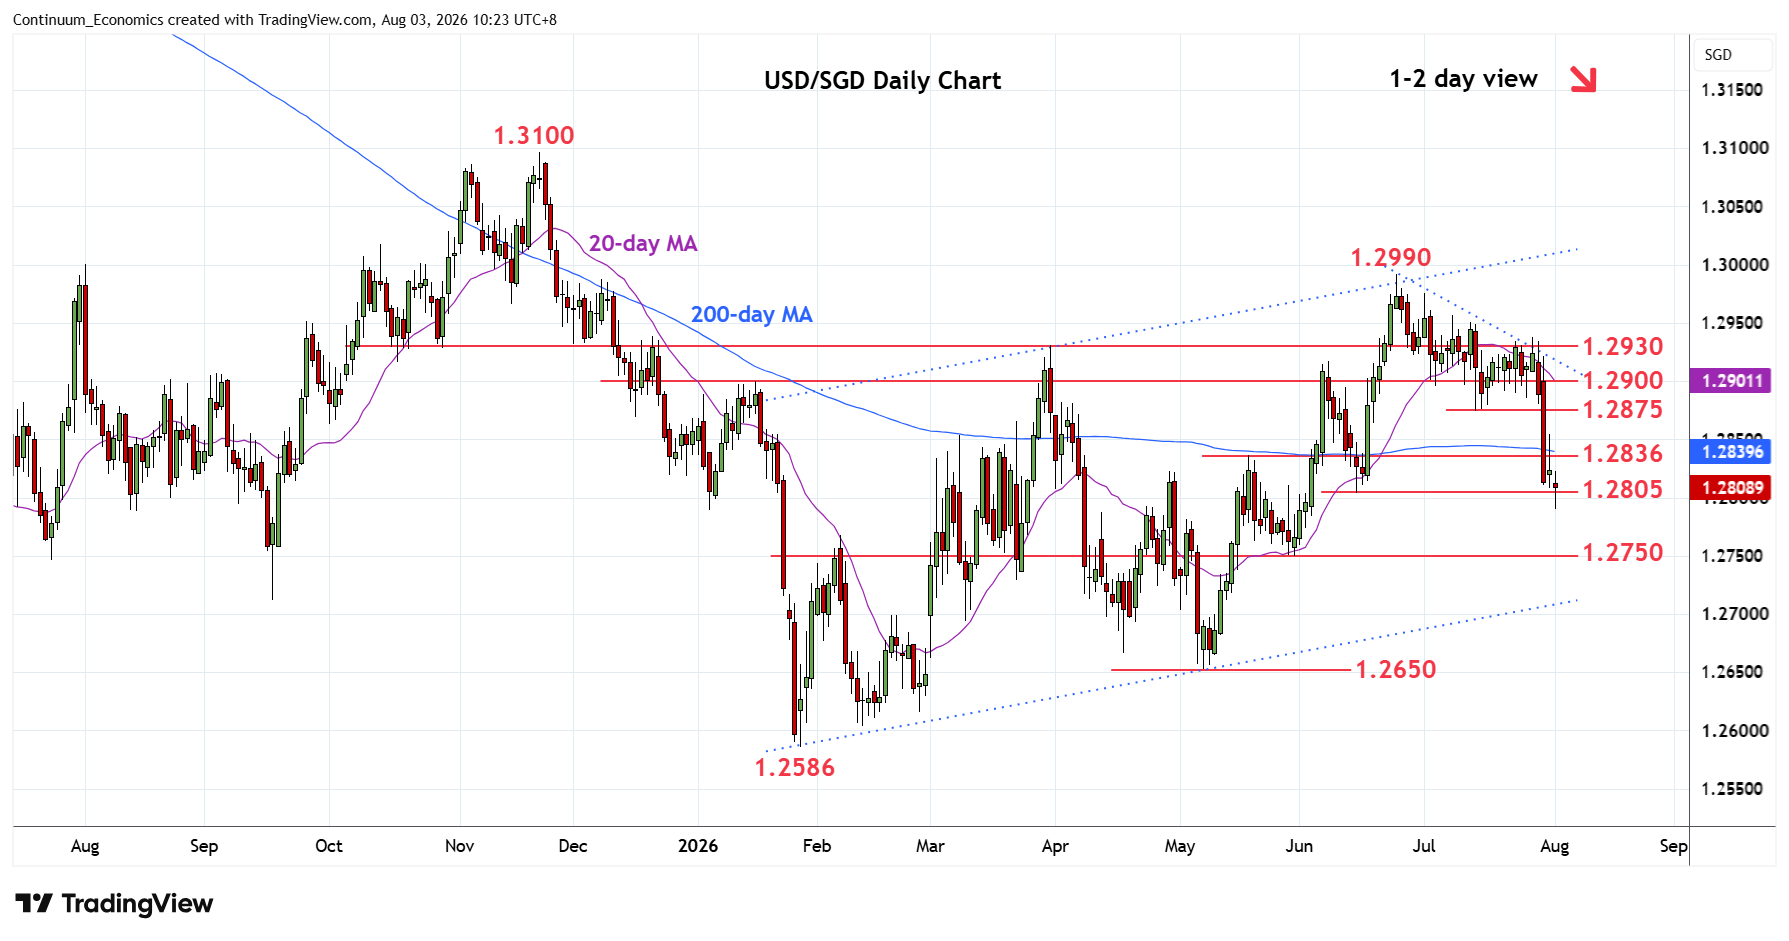
Weak opening see prices extending losses of last week to reach support at 2024 year low at 1.2788
| Level | Comment | Level | Comment | ||||
|---|---|---|---|---|---|---|---|
| R4 | 1.2930 | ** | Mar high, congestion | S1 | 1.2805 | * | 15 Jun low |
| R3 | 1.2900 | * | congestion | S2 | 1.2788 | * | 2024 year low |
| R2 | 1.2875 | ** | 14 Jul low | S3 | 1.2750 | * | congestion |
| R1 | 1.2836/50 | * | May high, congestion | S4 | 1.2700 | ** | congestion, 2025 yr low |
Asterisk denotes strength of level
02:40 GMT - Weak opening see prices extending losses of last week to reach support at 2024 year low at 1.2788. Consolidation here see prices unwinding oversold intraday studies but bearish structure from the 1.2990 June year high keep pressure on the downside and see room for deeper pullback within the bullish channel from January low. Lower will see room to support at the 1.2700 congestion and 2025 year low. Meanwhile, resistance at the 1.2836/50 congestion area expected to cap. Only above will see room for stronger corrective bounce to the 1.2875 mid-July low.