Published: 2026-09-28T16:42:37.000Z
Chart USD/IDR Updates: Pushing higher
4
Prices continue to extend gains from the 17500 monthly low of 9 September
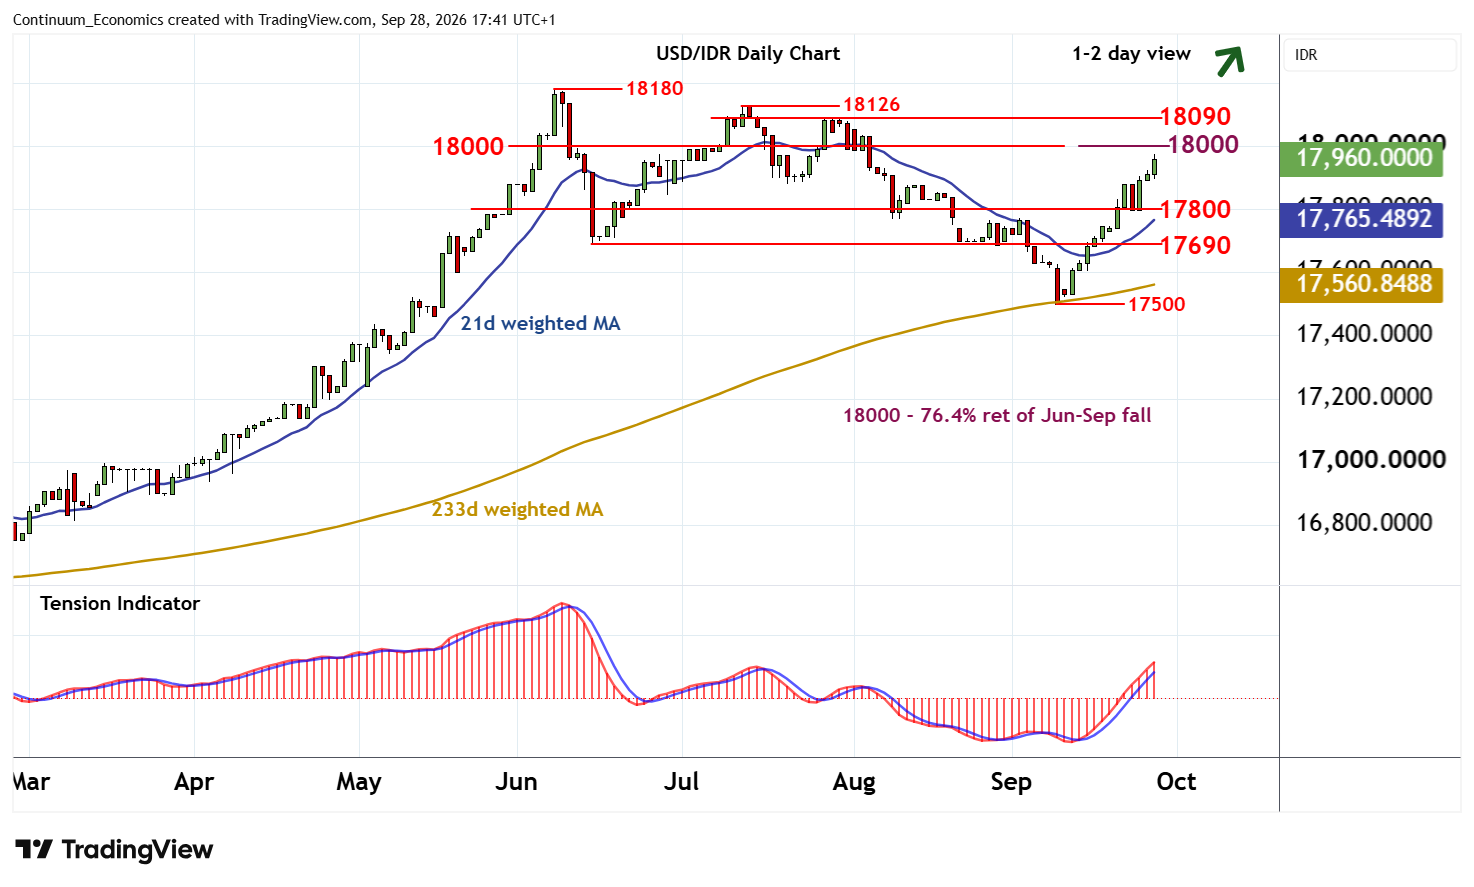
| Levels | Imp | Comment | Levels | Imp | Comment | |||
|---|---|---|---|---|---|---|---|---|
| R4 | 18126 | ** | 13 Jul (m) high | S1 | 17800 | * | congestion | |
| R3 | 18090 | * | 28 Jul high | S2 | 17690 | ** | Jun low | |
| R2 | 18000 | ** | cong; 76.4% ret | S3 | 17600 | * | congestion | |
| R1 | 17975 | * | intraday high | S4 | 17500 | ** | 9 Sep low |
Asterisk denotes strength of level
17:30 BST - Prices continue to extend gains from the 17500 monthly low of 9 September. Daily readings are rising, highlighting room for a test of strong resistance at 18000. But already overbought daily stochastics could limit any initial tests in consolidation, before rising weekly charts prompt a break. A close above here will further improve sentiment and extend September gains towards strong resistance within the 18090 - 18126 range.
Meanwhile, support is at congestion around 17800. A close beneath here, if seen, will add weight to sentiment and open up a test of 17690.