Published: 2026-10-05T02:59:33.000Z
Chart USD/CNH Update: Held firm above 6.7000 figure
2
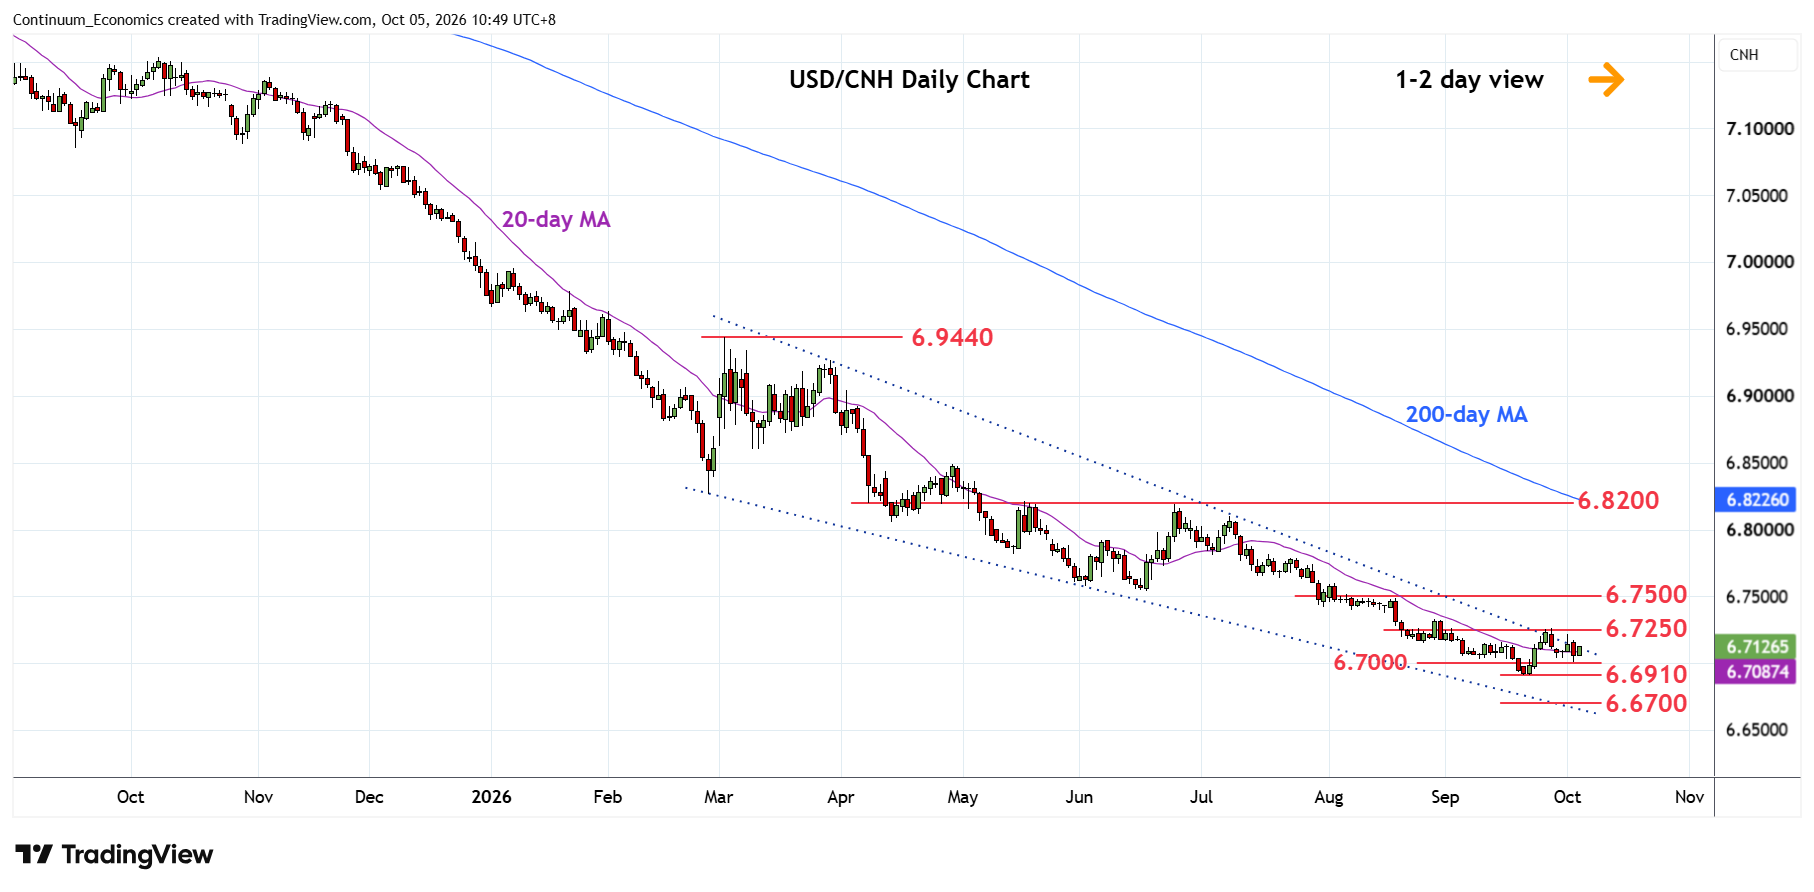
Drifted lower from gains to the 6.7250 congestion to reach the 6.7000 figure
| Level | Imp | Comment | Level | Imp | Comment | |||
|---|---|---|---|---|---|---|---|---|
| R4 | 6.7630 | * | 21 Jul low | S1 | 6.7000 | * | figure | |
| R3 | 6.7500/40 | ** | congestion, Jun low | S2 | 6.6910 | ** | 21 Sep YTD low | |
| R2 | 6.7400 | * | 7 Aug low, congestion | S3 | 6.6700 | ** | 2023 year low | |
| R1 | 6.7250 | * | congestion | S4 | 6.6500 | * | congestion |
Asterisk denotes strength of level
02:50 GMT - Drifted lower from gains to the 6.7250 congestion to reach the 6.7000 figure. Lack of momentum suggest further sideways ranging action within this area though positive daily studies and bullish divergence on weekly studies highlights scope for stronger gains to retrace losses from the 6.8200, June high. Higher will see room towards resistance at the 6.7330/6.7400 area. Break here will turn focus to strong resistance at 6.7500/40 area. Meanwhile, support at the 6.7000/6.6910 figure and and low should underpin. Failure, will see room for continuation to 6.6700 wedge support.