Published: 2026-06-30T16:22:33.000Z
Chart USD/MXN Update: Leaning lower
1
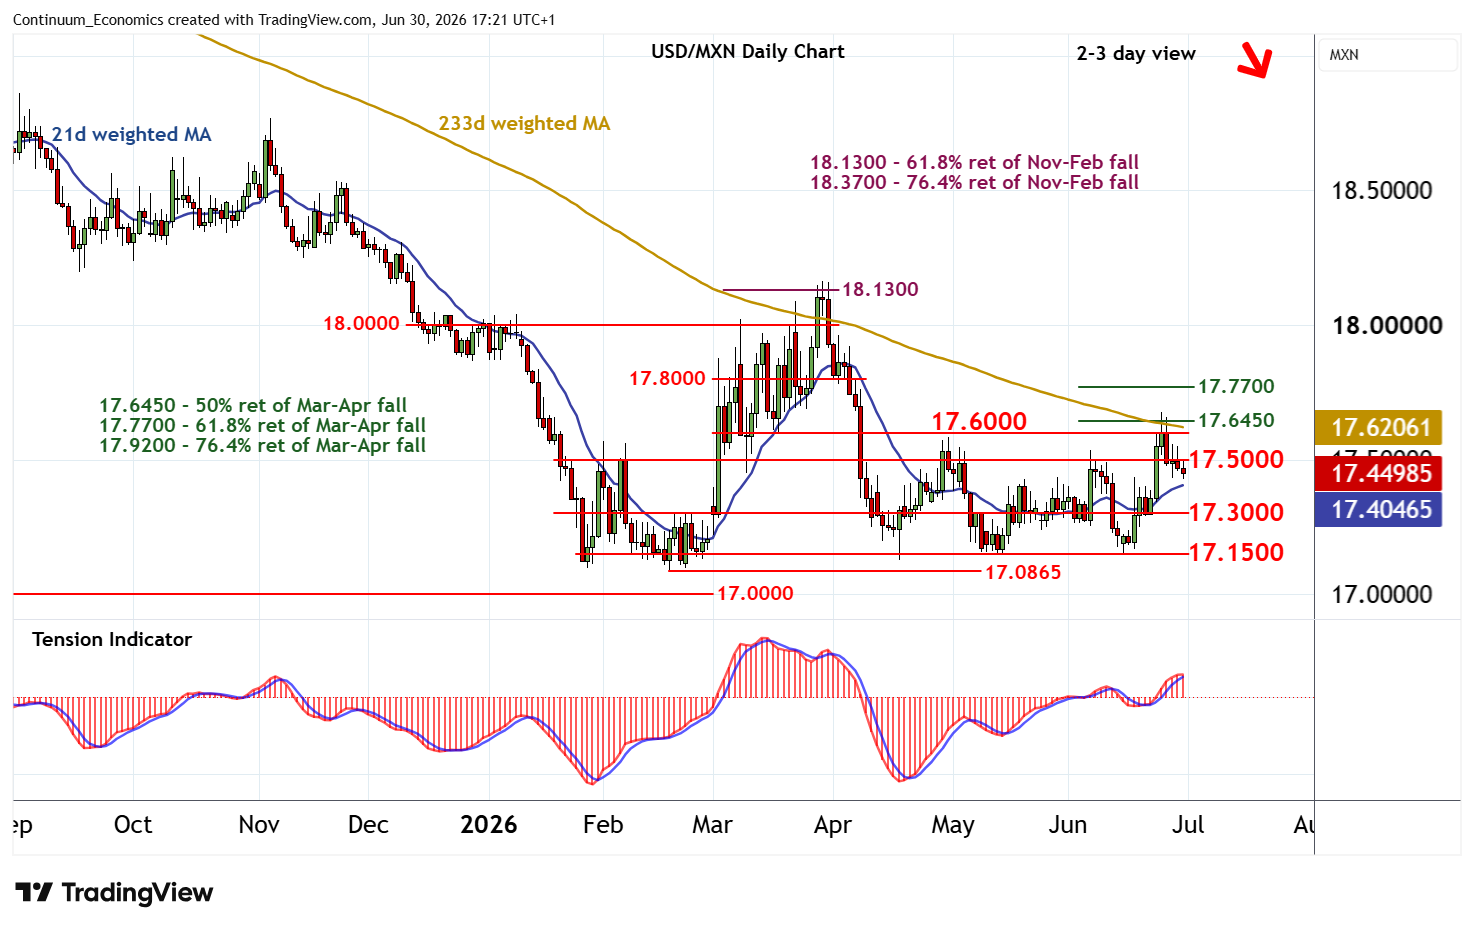
Anticipated gains have reached the 17.6450 Fibonacci retracement
| Levels | Imp | Comment | Levels | Imp | Comment | |||
|---|---|---|---|---|---|---|---|---|
| R4 | 17.7700 | ** | 61.8% ret of Mar-Apr fall | S1 | 17.3000 | * | break level | |
| R3 | 17.6450 | ** | 50% ret of Mar-Apr fall | S2 | 17.1500 | * | congestion | |
| R2 | 17.6000 | ** | congestion | S3 | 17.1270 | * | 17 Apr (m) low | |
| R1 | 17.5000 | ** | congestion | S4 | 17.0865 | ** | 18 Feb YTD low |
Asterisk denotes strength of level
17:05 BST - Anticipated gains have reached the 17.6450 Fibonacci retracement, before turning lower in renewed selling interest to trade below 17.5000. Both daily stochastics and the daily Tension Indicator are under pressure, highlighting room for continuation down to support at 17.3000. But improving weekly charts should limit any deeper retracement in renewed buying interest above congestion around 17.1500. Meanwhile, resistance remains at congestion around 17.5000 and extends to 17.6000. A close above here would turn price action positive and extend May gains beyond 17.6450 towards the 17.7700 retracement.