This week's five highlights
Bessent’s Buybacks
Escalation Risk in U.S.-Canada Trade Dispute
U.S. July and revised Q2 Core PCE Prices on the firm side
U.S. July Advance Goods Trade Shows Widest post-tariff deficit
UK's inflation momentum
Figure: US debt composition by segment
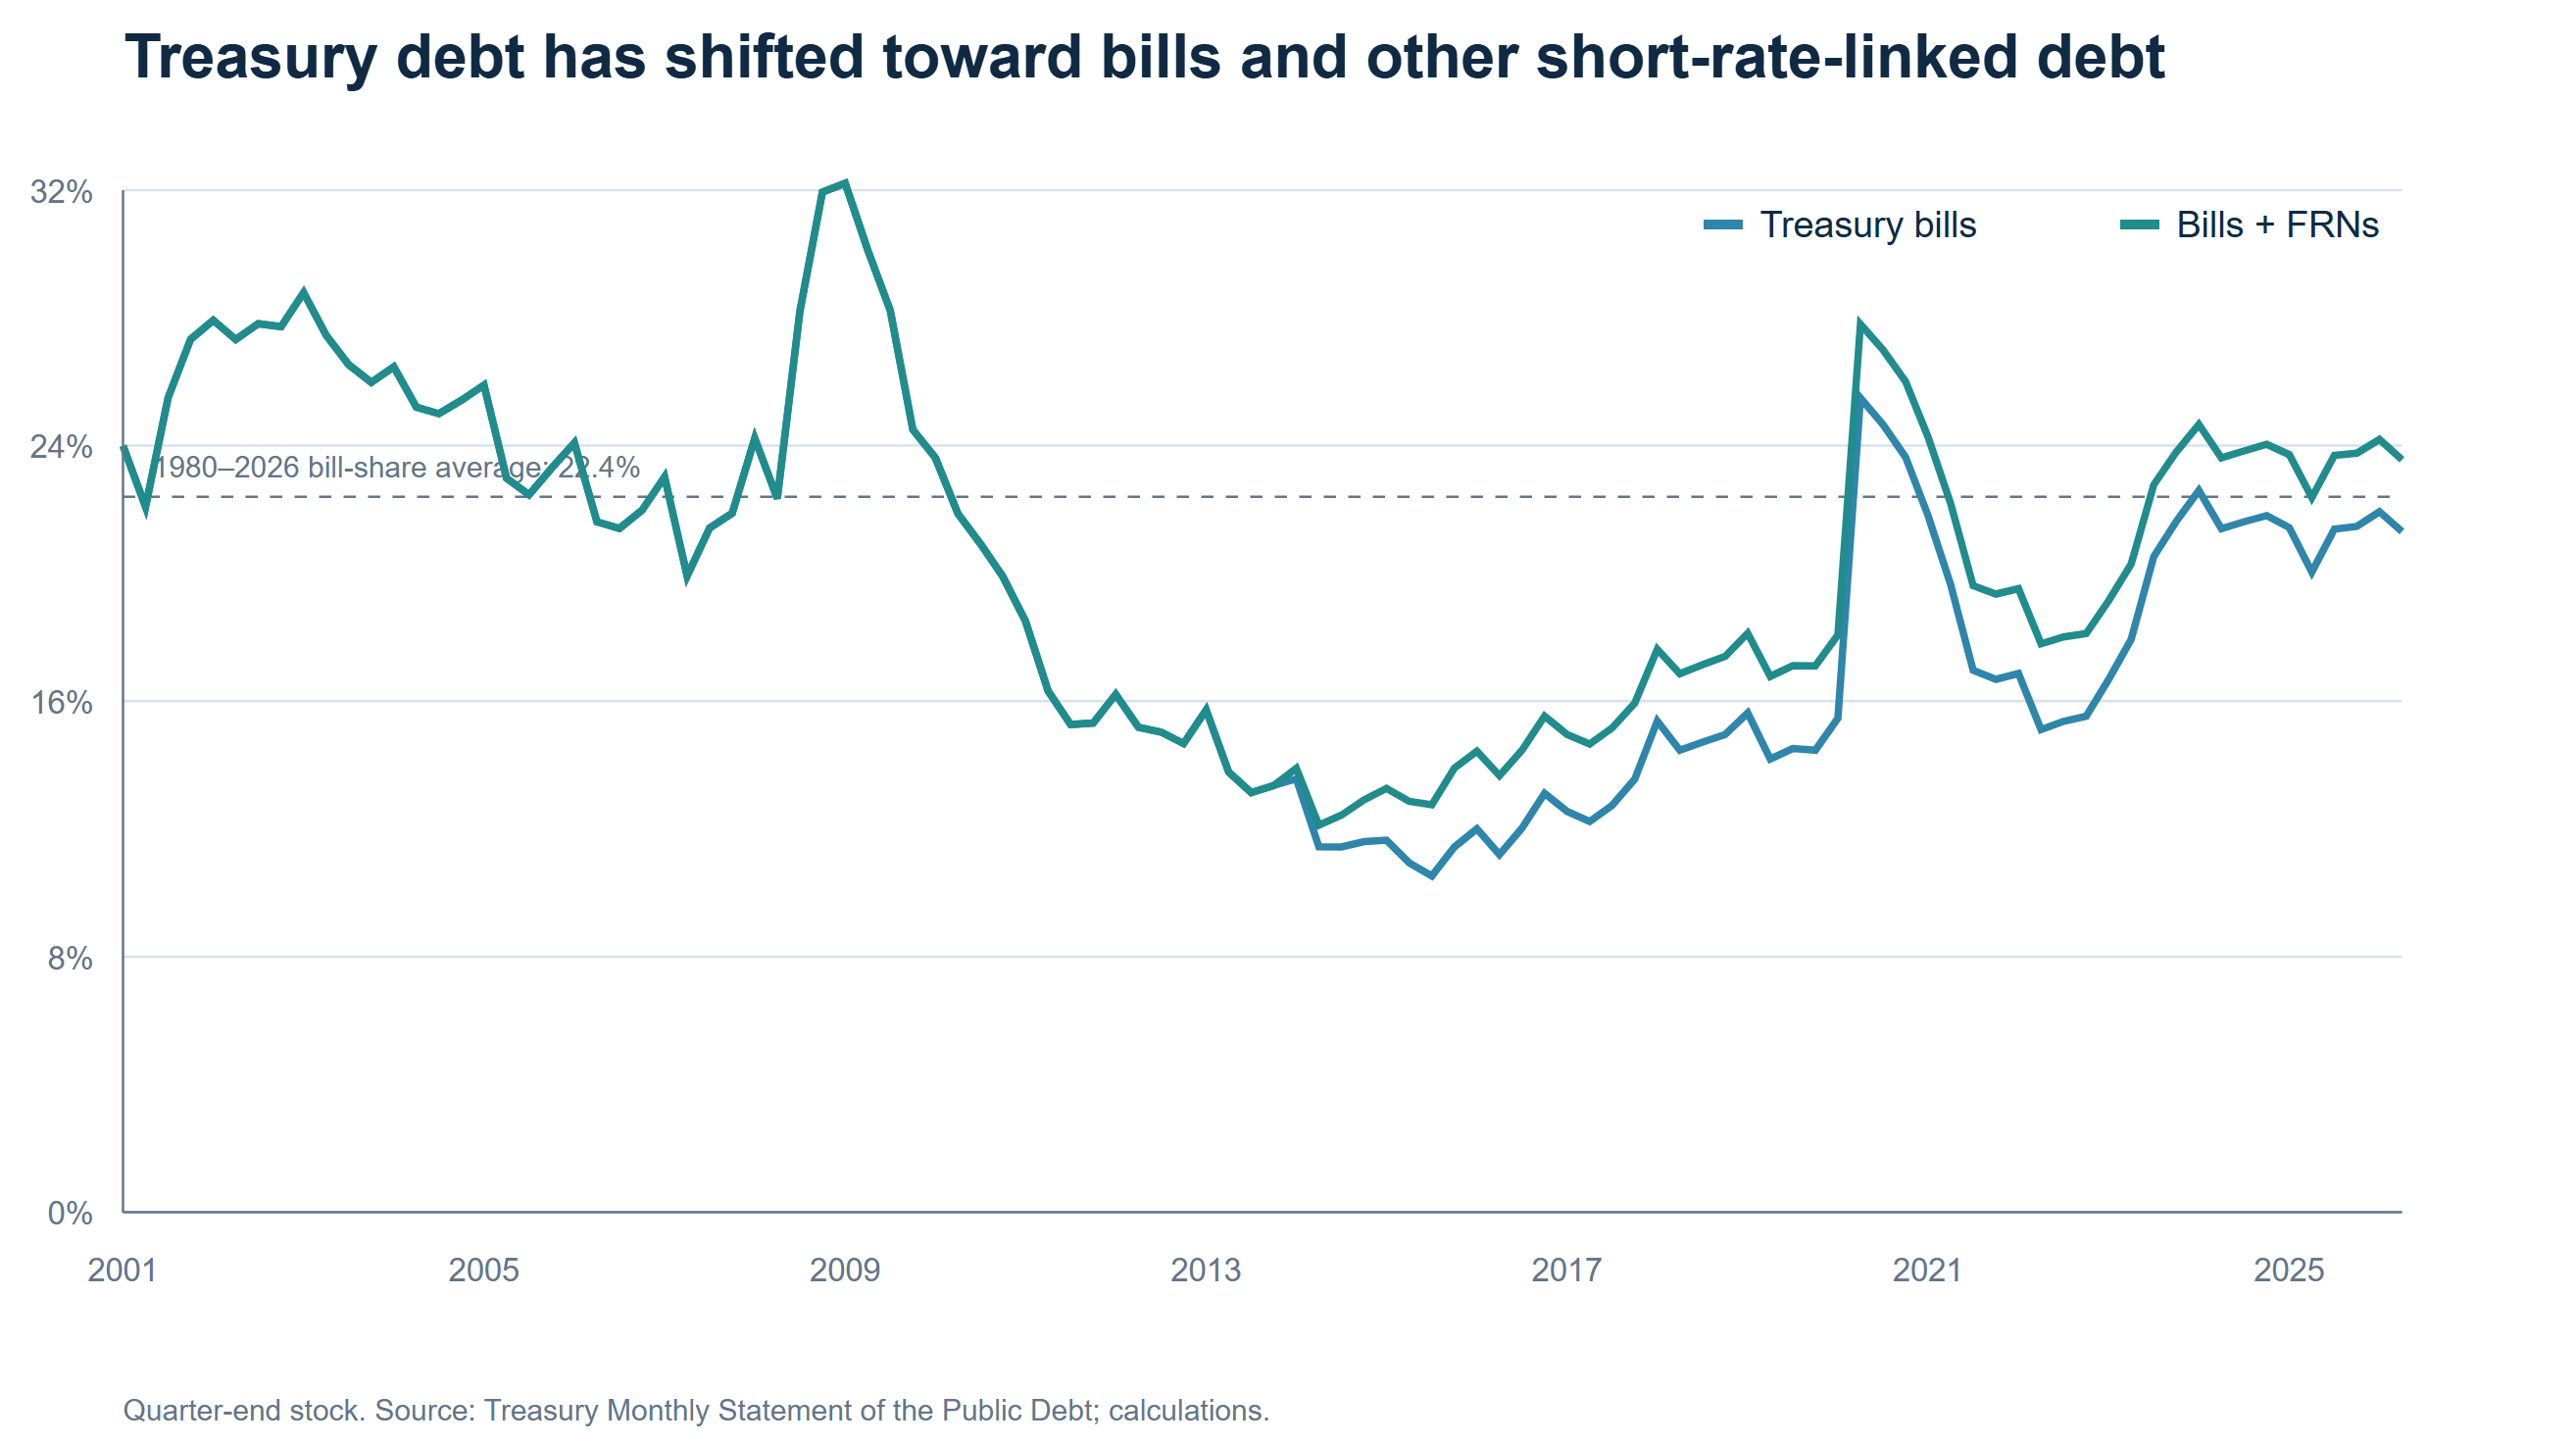
The market has had a few days to digest the surprise buyback announcement. US 2s30s has slipped back below 100bp, around 15bp off its recent highs, although that has been pivotal flattening, with much coming from a bounce in short-end yields.
Having gone out on a limb, the follow-up has largely sought to battle scepticism over scale and firepower. Bessent initially underscored that the increase represented 'at least' a doubling and that Treasury could do considerably more if needed. Meanwhile, some press reports (‘spoon-fed’ or not) have kite-flown the potential to use ‘excess cash’ in the Treasury General Account (TGA) at the Fed to cash-flow increased buybacks.
The TGA (essentially the government’s current account, managing tax receipts, issuance and redemption flows, and expenditure) currently stands at around $950bn. That is somewhat elevated relative to the roughly $500–600bn maintained under the previous administration.
Some of the increase has provided cushioning around churn in tariff receipts and refunds, although a chunk of those refunds has now been dispensed. It also reflects the elevated size of the gross flows Treasury needs to manage, alongside the perennial need to buffer against debt-ceiling disputes and shutdown risks (though not material until next year).
In theory, Treasury could run it tighter, supported by more active T-bill management. If it chose to reduce its cash buffer by perhaps $100–200bn, possibly more, that could provide significant temporary firepower for duration removal, if not quite the cliched bazooka.
Buybacks are in principle fine, of course - corporates used to do it until the sudden AI cash demand (only half joking). But it’s fine from a position of cash flow strength or to genuinely deal with issue level liquidity. The concern is rather different when they are being conducted from a position of persistent financing need.
The second version of the same idea is to use the TGA primarily as a cash-flow smoother, with more extended buybacks ultimately financed through short-end, and most likely T-bill, issuance. Over a longer period, the two approaches really amount to essentially the same thing unless the deficit is reduced. There’s no free lunch.
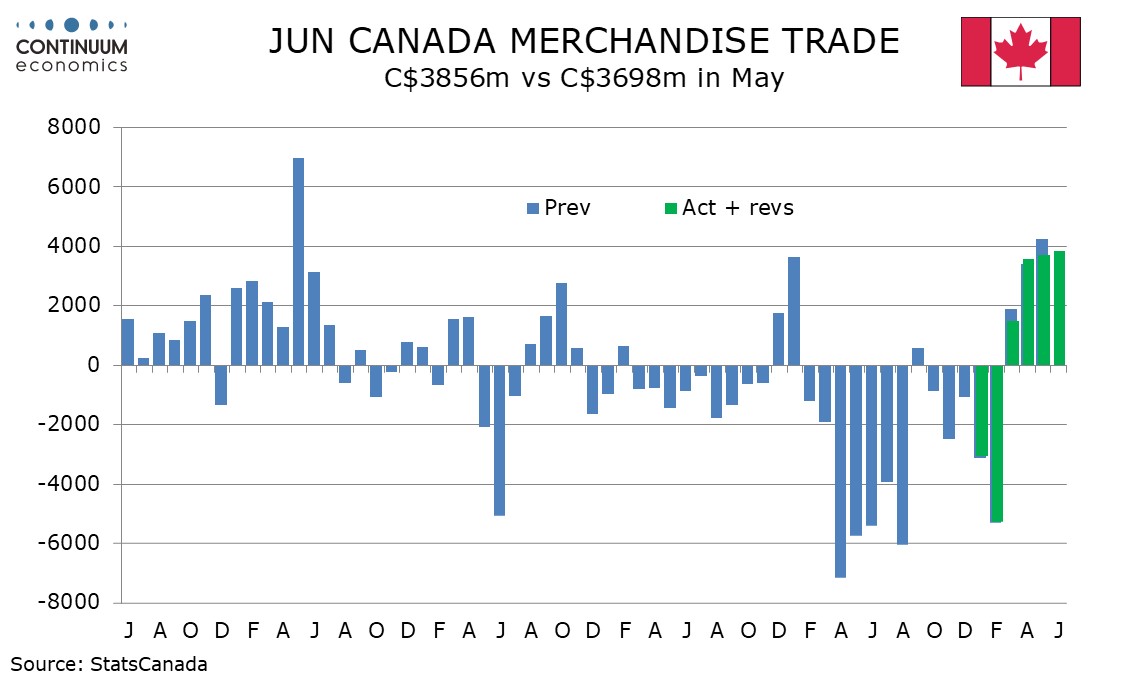
The immediate economic impact of the collapse of the US-Canada trade talks is likely to be modest, but not insignificant in the case of Canada. Where things move from here is uncertain, with Canadian retaliation due to be implemented on September 8, and risk of further mutual escalations after that. The risk that Trump will back down is also significant, either before or after any such escalation.
Exactly what caused the collapse in talks is unclear, with both sides blaming the other, but it appears that US demands extended onto areas Canada was not willing to discuss, including Canada’s trading relations with other nations and a US desire for goods sold in Quebec need not be labelled in French, prompting Canada to walk away from the talks. Canada’s government had already been under domestic pressure not to concede too much, on issues such as pushing provincial governments to put US alcohol back on liquor store shelves. 50% tariffs on Canadian exports sounds large, but the freshly implemented tariffs impact only around 5% of Canadian exports to the US, making up marginally above 1.0% of Canadian GDP, suggesting the hit to Canadian GDP is unlikely to exceed 0.5%. That is enough to push H2 2026 Canadian GDP slightly below potential after what is likely to be a strong Q2, but not enough to push Canada into recession. Still, the impact on the targeted industries will be severe, and that will impact Canadian public opinion well beyond those directly impacted.
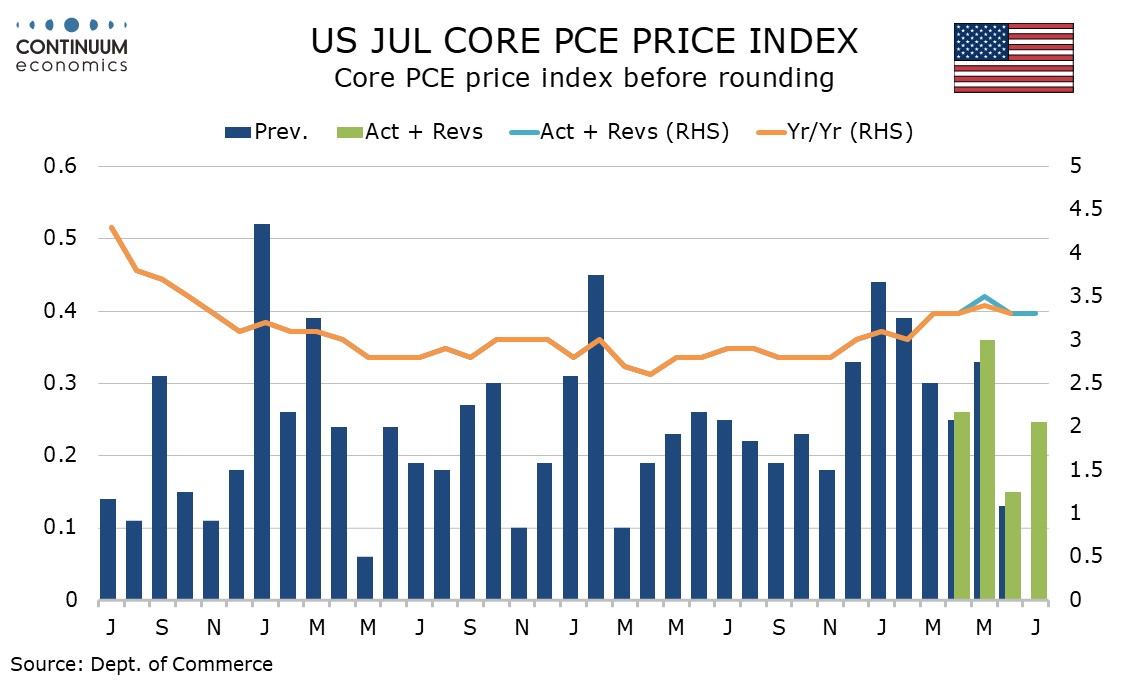
While July’s core PCE price index came in at 0.2% as expected, before rounding the rise was 0.246%. Q2’s core PCE price index was revised up to 3.6% annualized from 3.4%, making the data a modest disappointment, which will sustain Fed inflationary worries, though is not quite enough to make a September tightening likely. July personal income and spending were also on the firm side of expectations. Q2 GDP revisions and July durable goods orders data were mixed.
June core PCE prices were revised to 0.147% from 0.13%, May to 0.36% from 0.33% and April to 0.26% from a low 0.25%, meaning that the April and May revisions were visible before rounding, but June’s was not quite. Yr/yr core PCE prices at 3.3% match the paces of June, March and April, while May was revised up to 3.5% from 3.4%. All are clearly above the Fed’s 2.0% target.
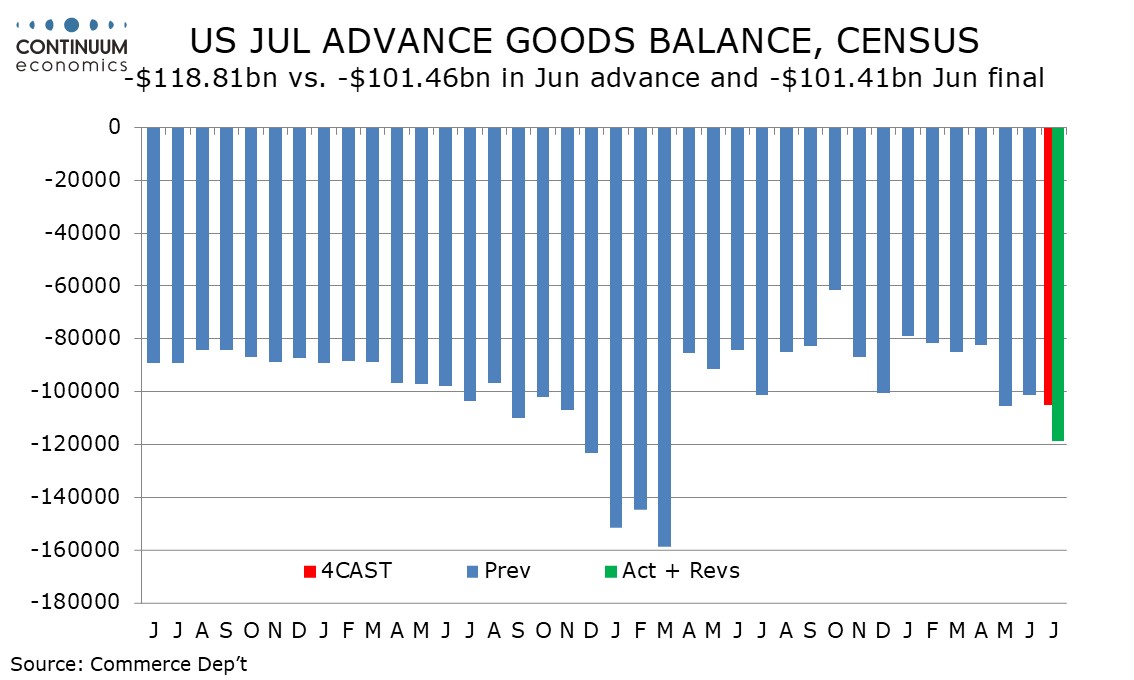
July’s advance goods trade deficit of $118.8bn versus $101.4bn in June is the widest since the record $158.7bn seen in March 2025 ahead of the tariffs. The deficit has picked up since the Supreme Court ruled against the reciprocal tariffs introduced in April 2025. Initial claims remain low, falling to 203k from 207k.
The trade data shows exports down 2.9%, a third straight decline, while imports rose by 3.7%, rebounding from a 2.4% June decline. The exports decline can only partially be explained by a 1.3% fall in prices while imports increased despite a 0.4% decline in prices.
Figure: A basic UK version of Inflation Shock Momentum Index (ISMI)
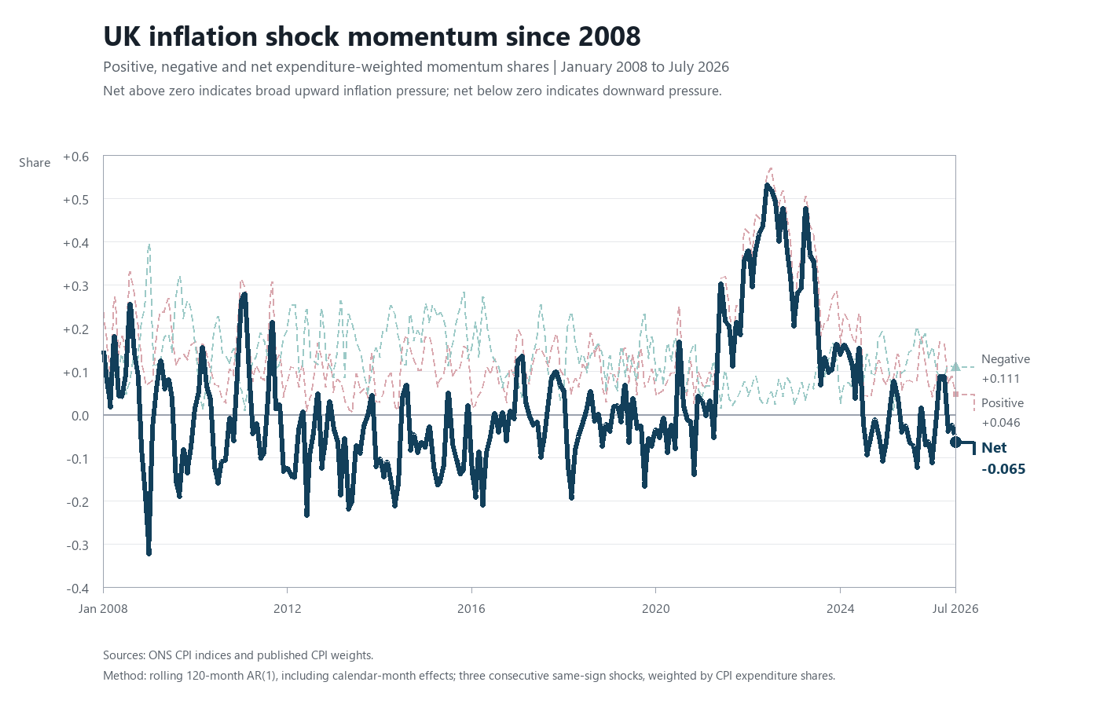
The message coming from last week’s UK data - higher energy prices and a softer labour market - was discussed recently (here). This article zooms in to look at some alternative data viewpoints on UK inflation, focusing in on areas that are of most importance to the BoE: momentum, persistence, and second round effects.
The overall message is reassuring in aspects, less so or more equivocal in others. That’s a conclusion that fits with the Bank’s ongoing open minded ‘wait and see’ approach, pausing to see how the balance develops into the end of the year, given downside growth risks.
To look first at momentum and breadth of inflation pressures, we first proxy a basic UK version of the Inflation Shock Momentum Index (ISMI). This measure ‘is intended to track persistent inflationary or disinflationary pressures in real time by identifying sustained directional runs in shocks to monthly inflation’. It is applied to the UK’s 85 categories and gives an expenditure-weighted net balance of components showing 3 month upward surprises to trend versus those showing downside.
The positive message here is that, even though July, the measure remained slightly negative and has been chopping round flat to negative through much of the year. That fits with a view that there is no sustained additional upward supply shock currently materialising and indeed if anything broad momentum has been flagging, thus far.