Published: 2026-06-05T02:14:03.000Z
Chart USD/SGD Update: Extending gains
2
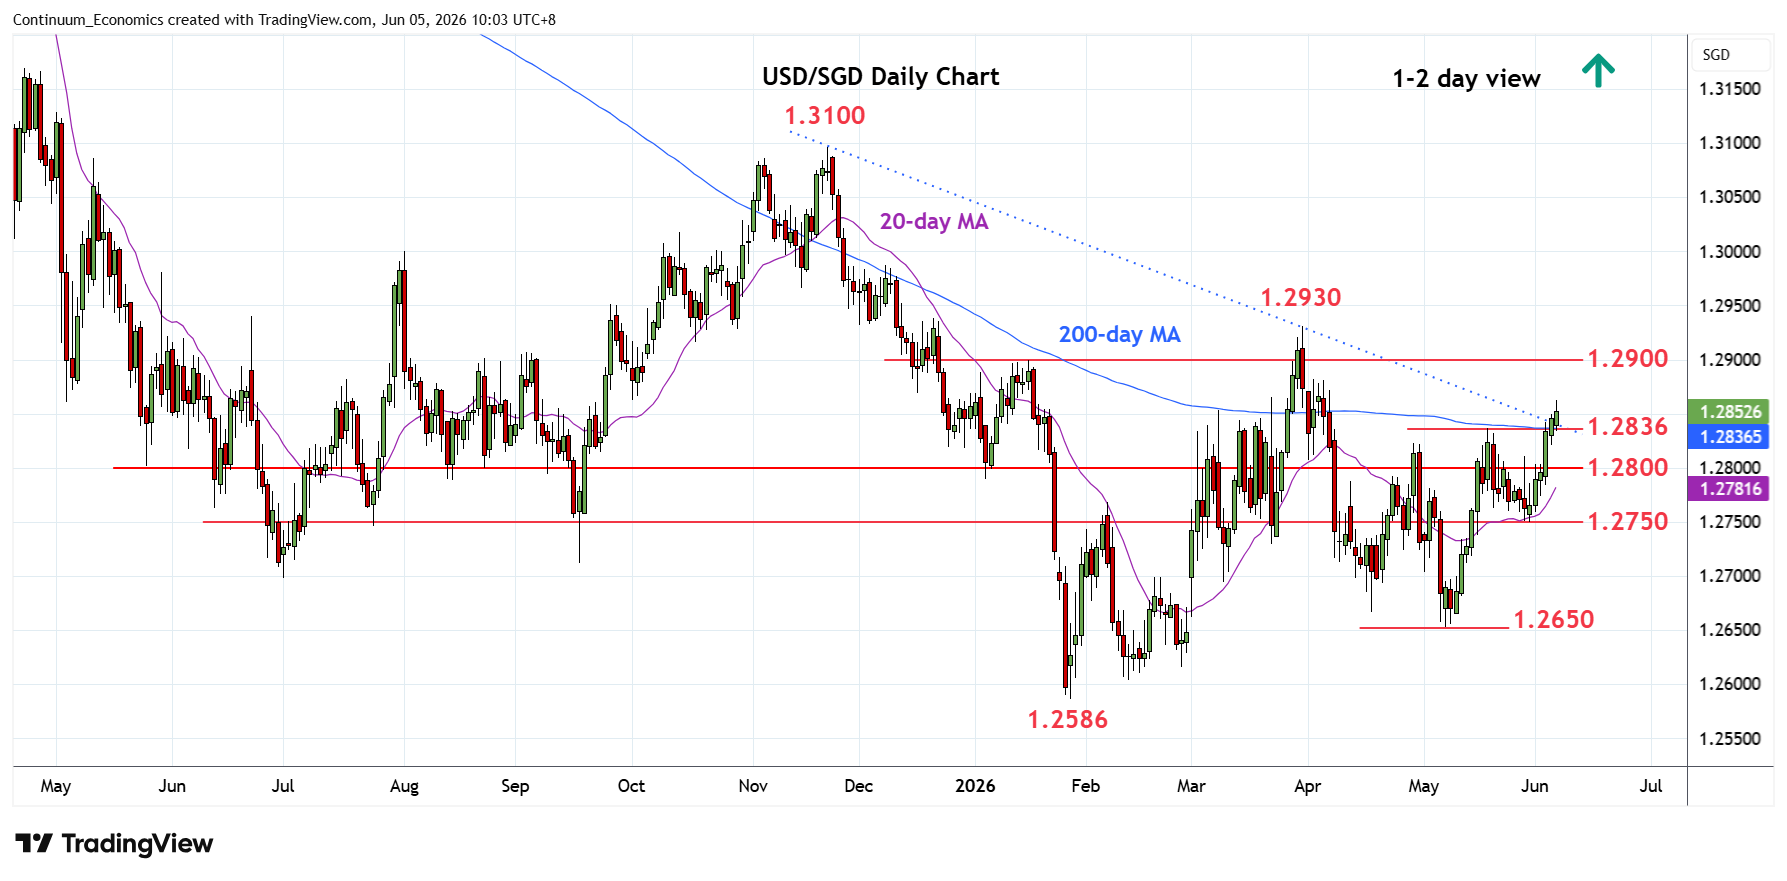
Break above the 1.2836 high and 200-day MA see prices extending the broader gains from the 1.2650 May low
| Level | Comment | Level | Comment | ||||
|---|---|---|---|---|---|---|---|
| R4 | 1.3000 | ** | figure, congestion | S1 | 1.2800 | * | congestion |
| R3 | 1.2950 | * | congestion | S2 | 1.2750 | ** | 29 May low |
| R2 | 1.2930 | ** | 31 Mar YTD high | S3 | 1.2735 | * | 13 May high |
| R1 | 1.2900 | * | Jan high, congestion | S4 | 1.2700 | ** | congestion |
Asterisk denotes strength of level
02:15 GMT - Break above the 1.2836 high and 200-day MA see prices extending the broader gains from the 1.2650 May low. Above the 1.2850 congestion and trendline from the November high see room for extension to retest resistance at the 1.2900 level and the 1.2930 March current year high where reaction can be expected. Meanwhile, support remains at the 1.2800 level which should underpin and sustain bounce from the 1.2750 low. Would take break of the latter to fade the upside pressure and see deeper pullback to retrace gains from the 1.2650 low.