Published: 2026-06-22T04:43:51.000Z
Chart USD/INR Update: Consolidating above 94.1800 low
1
Little change, as prices holds steady above the 94.1800 low to consolidate recent losses from the 95.8500 high
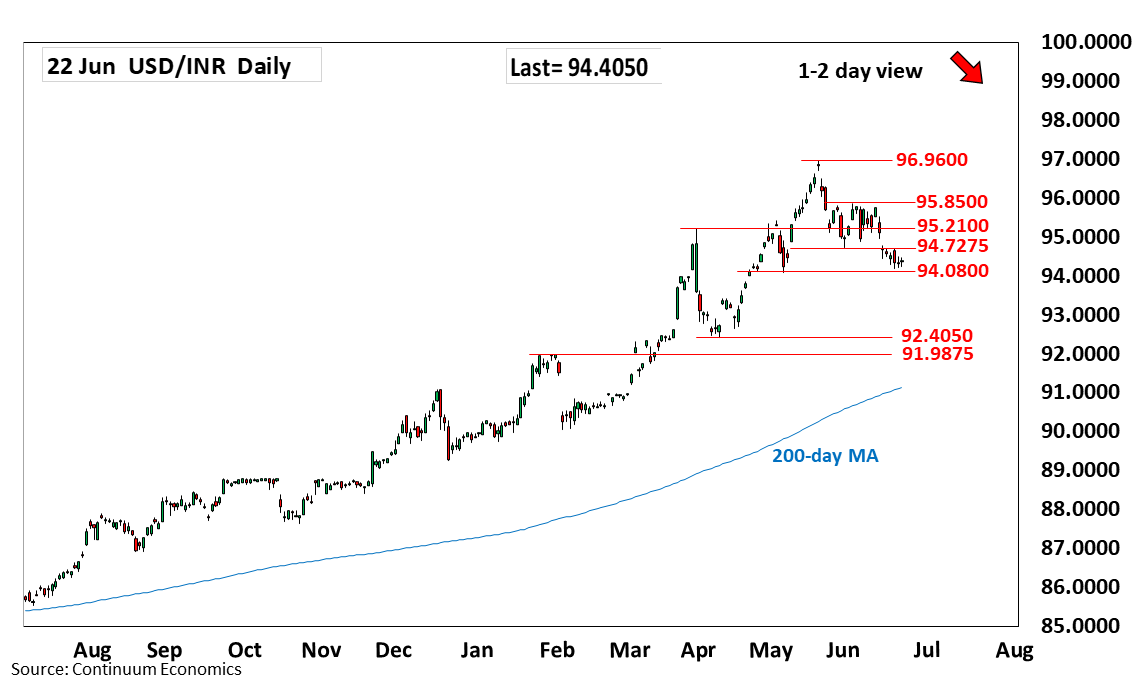
| Level | Comment | Level | Comment | |||||
|---|---|---|---|---|---|---|---|---|
| R4 | 96.0000 | * | figure | S1 | 94.1800 | * | 18 Jun low | |
| R3 | 95.8500 | ** | 3 Jun high | S2 | 94.0800 | ** | May low | |
| R2 | 95.2100 | ** | Mar high | S3 | 93.4100 | ** | 15 Apr high | |
| R1 | 94.7275 | * | 1 Jun low | S4 | 93.0000 | * | figure, congestion |
Asterisk denotes strength of level
04:45 GMT - Little change, as prices holds steady above the 94.1800 low to consolidate recent losses from the 95.8500 high. Consolidation is expected to give way to fresh selling pressure later. Lower will see room to nearby support at the 94.0800/94.0000 area. Would take break here to open up room for deeper pullback to support at 93.4100 then the 93.0000 figure. Meanwhile, resistance starts at the 94.7275 low of 1 June and this extend to 95.2100 March high which is expected to cap. Break, if seen, will open up room for stronger bounce to retest of resistance at 95.8500.