Published: 2026-06-25T04:56:15.000Z
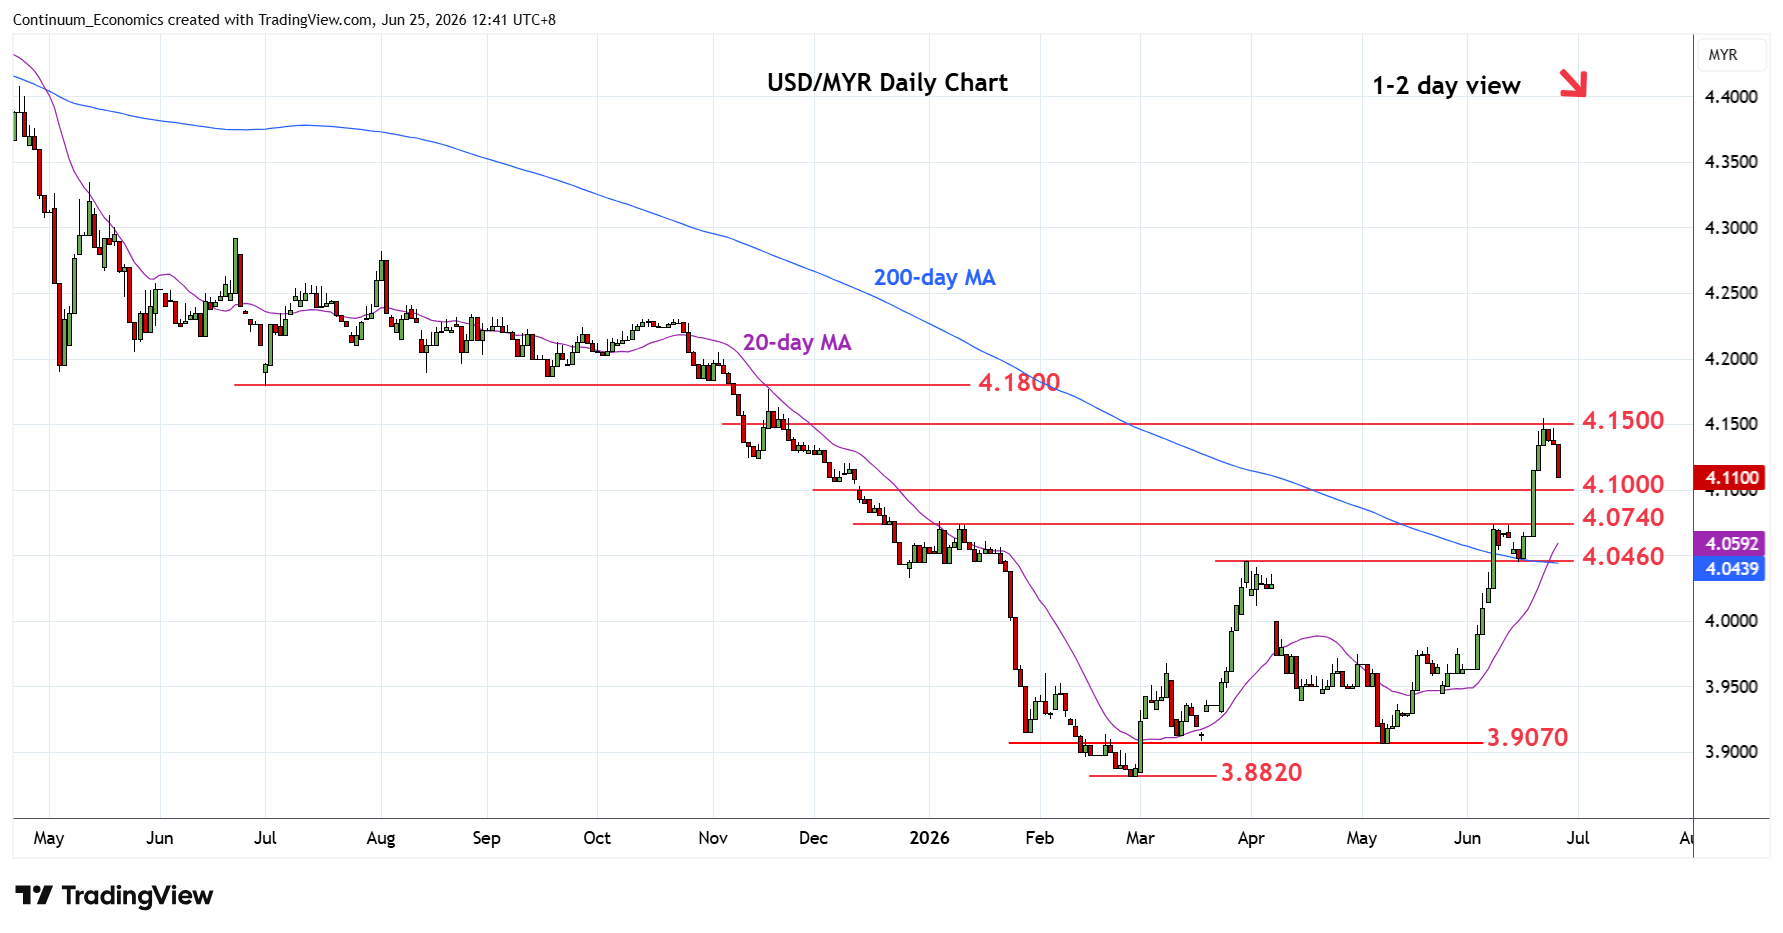
Chart USD/MYR Update: Turned down from 4.1545 fresh year high
-
Edged above resistance at 4.1500 congestion before settling back from 4.1545 fresh year high
| Levels | Imp | Comment | Levels | Imp | Comment | |||
|---|---|---|---|---|---|---|---|---|
| R4 | 4.2200 | * | congestion | S1 | 4.1000 | * | congestion | |
| R3 | 4.2000 | ** | congestion, 50% | S2 | 4.0740 | ** | 8 Jun high | |
| R2 | 4.1800 | ** | 2025 year low | S3 | 4.0460 | ** | Mar high | |
| R1 | 4.1545 | ** | 22 Jun YTD high | S4 | 4.0000 | * | figure, congestion |
Asterisk denotes strength of level
04:40 GMT - Edged above resistance at 4.1500 congestion before settling back from 4.1545 fresh year high. Daily studies have turned down to unwind overbought readings following strong gains from the 3.9070 May swing low. Pullback below 4.1200 opens up room for deeper retracement to 4.1000 level. Break here will see room to strong support at 4.0740/4.0460, 8 June and March highs. Below the latter will fade the upside pressure and see room for deeper retracement to 4.0000 figure. Break above 4.1545 high, if seen, will see scope to 4.1800/4.2000 resistance.