Chart USD/MYR Update: Consolidating test of 4.0750/4.0800 area
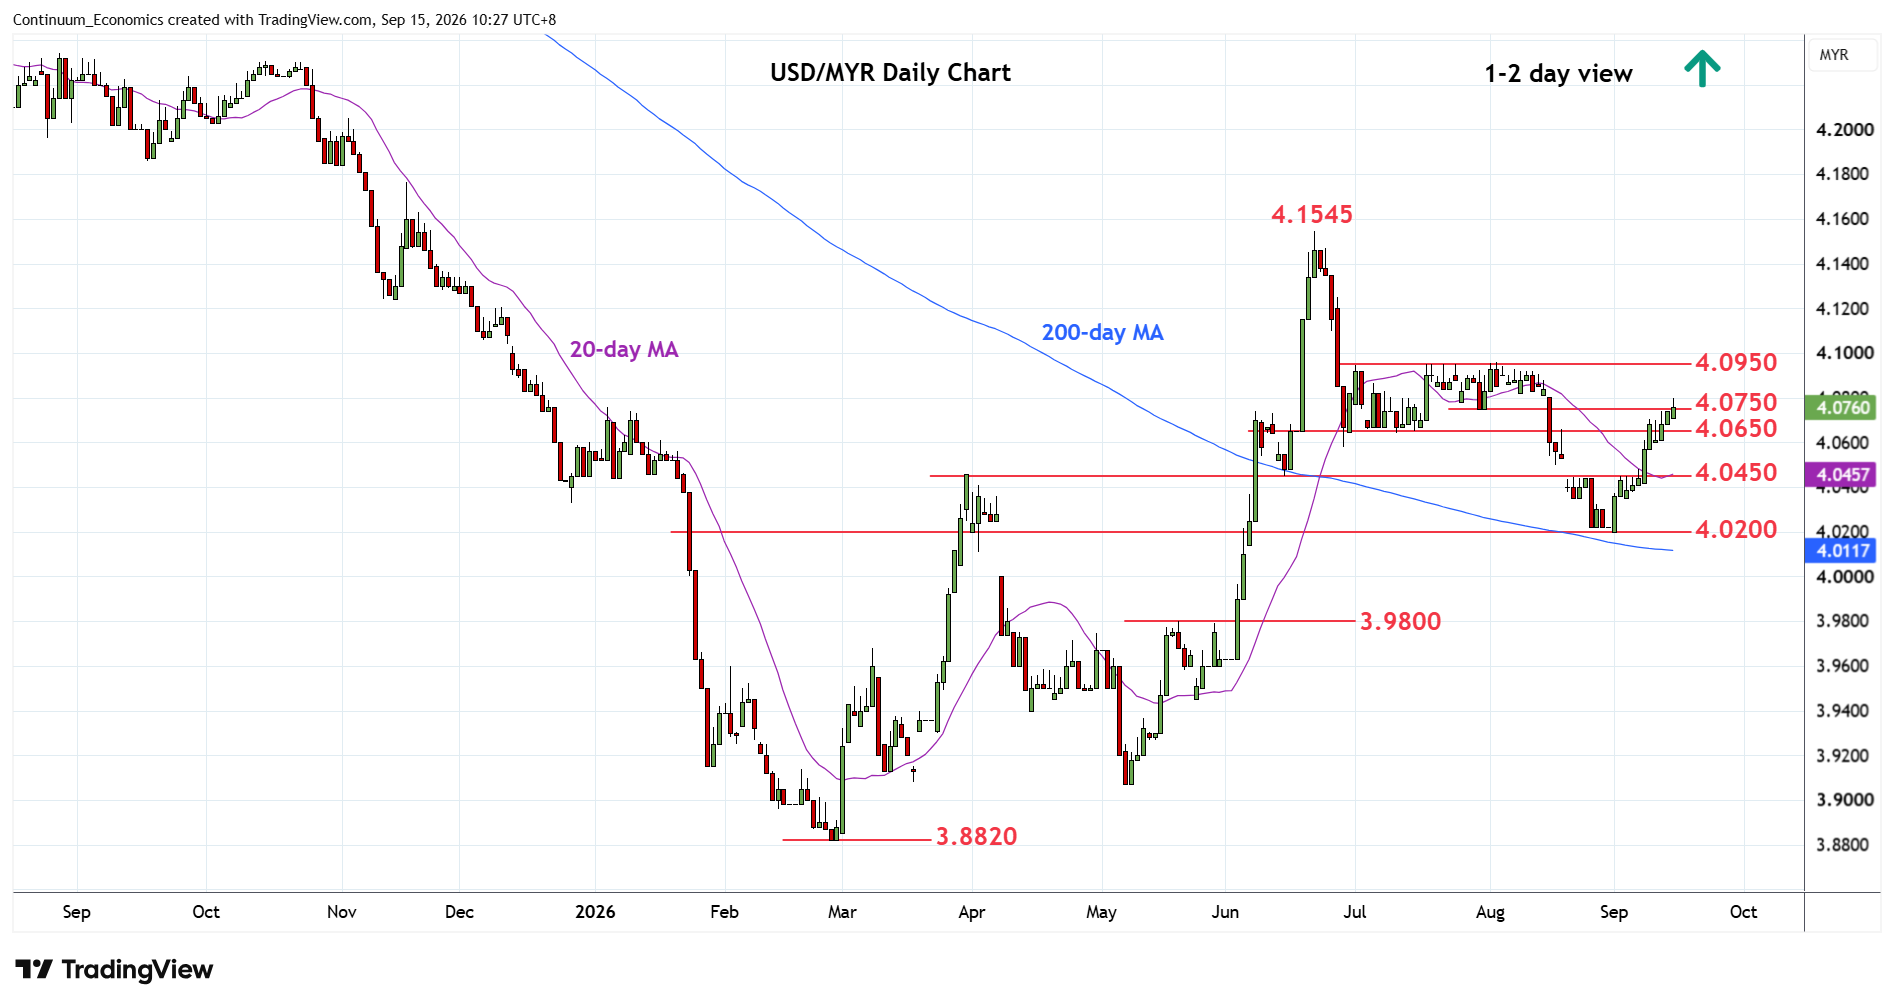
Pressuring the 4.0750 resistance and scope seen for break to extend strong gains from the 4.0200 low
| Levels | Imp | Comment | Levels | Imp | Comment | |||
|---|---|---|---|---|---|---|---|---|
| R4 | 4.1100 | 25 Jun low | S1 | 4.0600 | * | congestion | ||
| R3 | 4.0950 | ** | Jul, Aug highs | S2 | 4.0450 | ** | 2 Sep high | |
| R2 | 4.0800 | * | congestion | S3 | 4.0200 | * | congestion | |
| R1 | 4.0750 | * | 30 Jul low | S4 | 4.0000 | ** | figure, 61.8% |
Asterisk denotes strength of level
02:35 GMT - Pressuring the 4.0750 resistance and scope seen for break to extend strong gains from the 4.0200 low. Both the intraday and daily studies have turned mixed at overbought areas and but bullish momentum suggest scope for break later. Above the 4.0750/4.0800 area will open up room for extension to strong resistance at 4.0950, July/August highs. Meanwhile, support is raised to 4.0600 level. Below here will see room for consolidation to 4.0450 congestion and March high. Would take break here to fade the upside pressure and see return to the 4.0200 low and extend the June losses to the 4.0000 figure and 61.8% Fibonacci level.