Published: 2026-06-12T04:41:26.000Z
Chart USD/IDR Updates: Extending losses from 18180 historic high
4
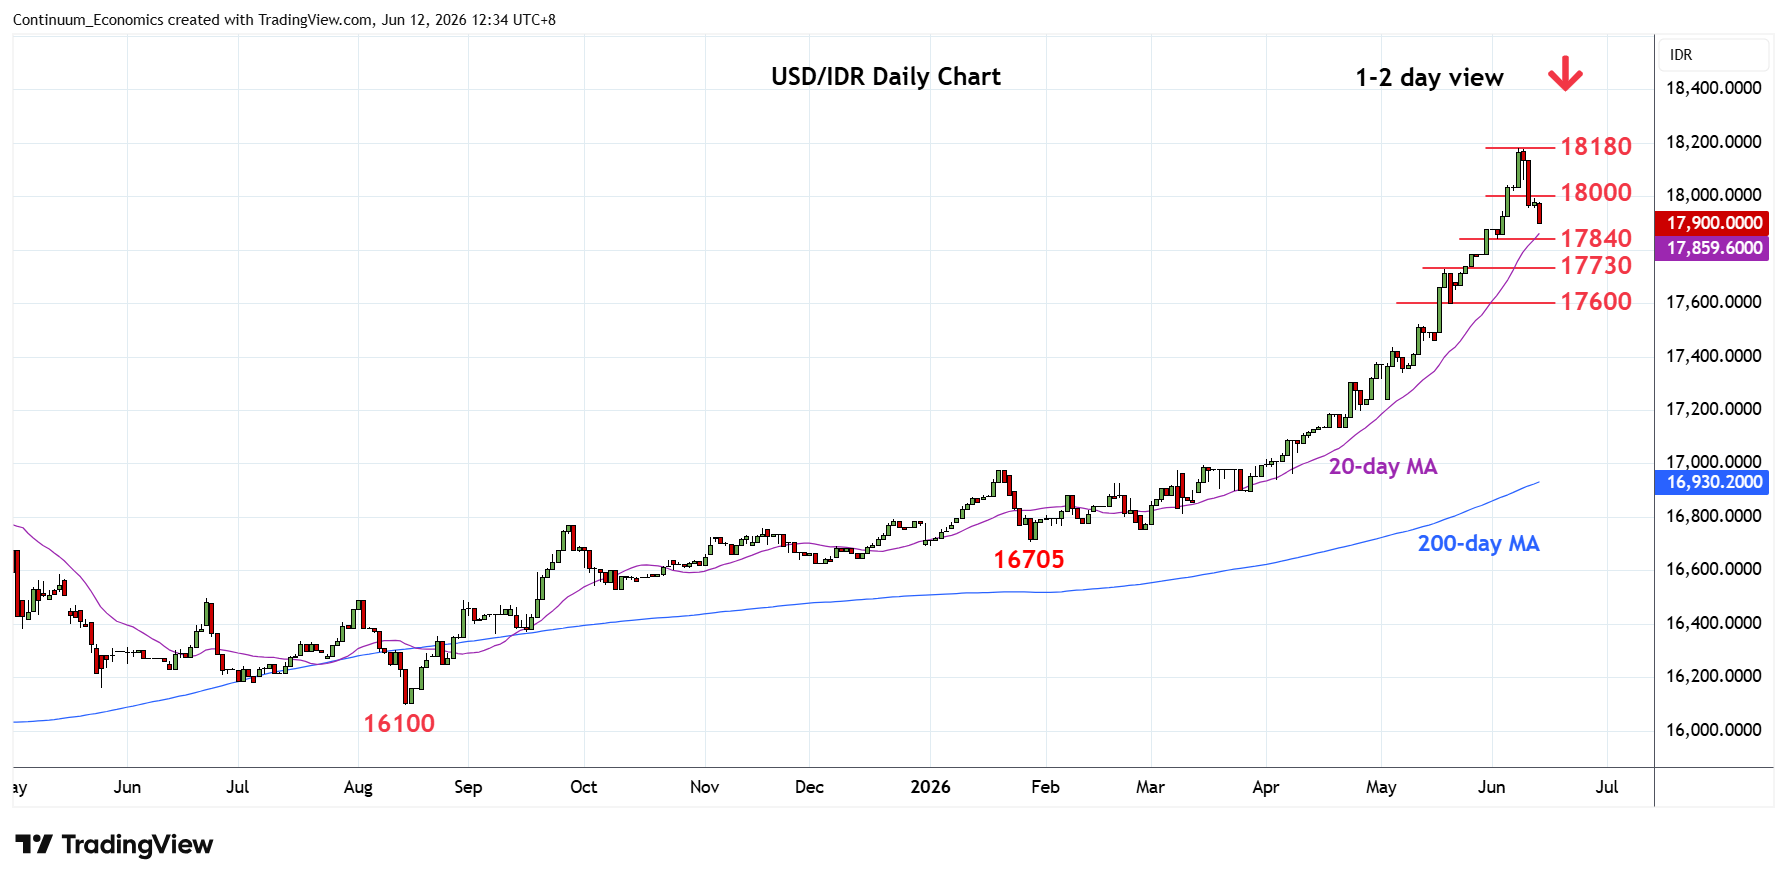
Extending rejection from the 18180 Monday's all-time high following break of the 18000 level
| Levels | Imp | Comment | Levels | Imp | Comment | |||
|---|---|---|---|---|---|---|---|---|
| R4 | 18500 | projection | S1 | 17880 | 29 May high | |||
| R3 | 18200 | projection | S2 | 17840 | * | 2 Jun low | ||
| R2 | 18180 | ** | 8 Jun all-time high | S3 | 17730 | * | 19 May high | |
| R1 | 18000 | * | figure | S4 | 17600 | * | congestion |
Asterisk denotes strength of level
04:35 GMT - Extending rejection from the 18180 Monday's all-time high following break of the 18000 level. Lower will see room to the support at the 17880/17840 congestion as prices unwind overbought daily studies and correct parabolic gains from the 16705, January current year low. Lower still, will see room for deeper pullback to support at 17730 then the 17600/17500 congestion area. Meanwhile, resistance is lowered to the 18000 figure which is expected to cap and sustain pullback from the 18180 high.