Published: 2026-06-09T06:27:03.000Z
Chart USD/IDR Updates: Lower in range from 18180 historic high
4
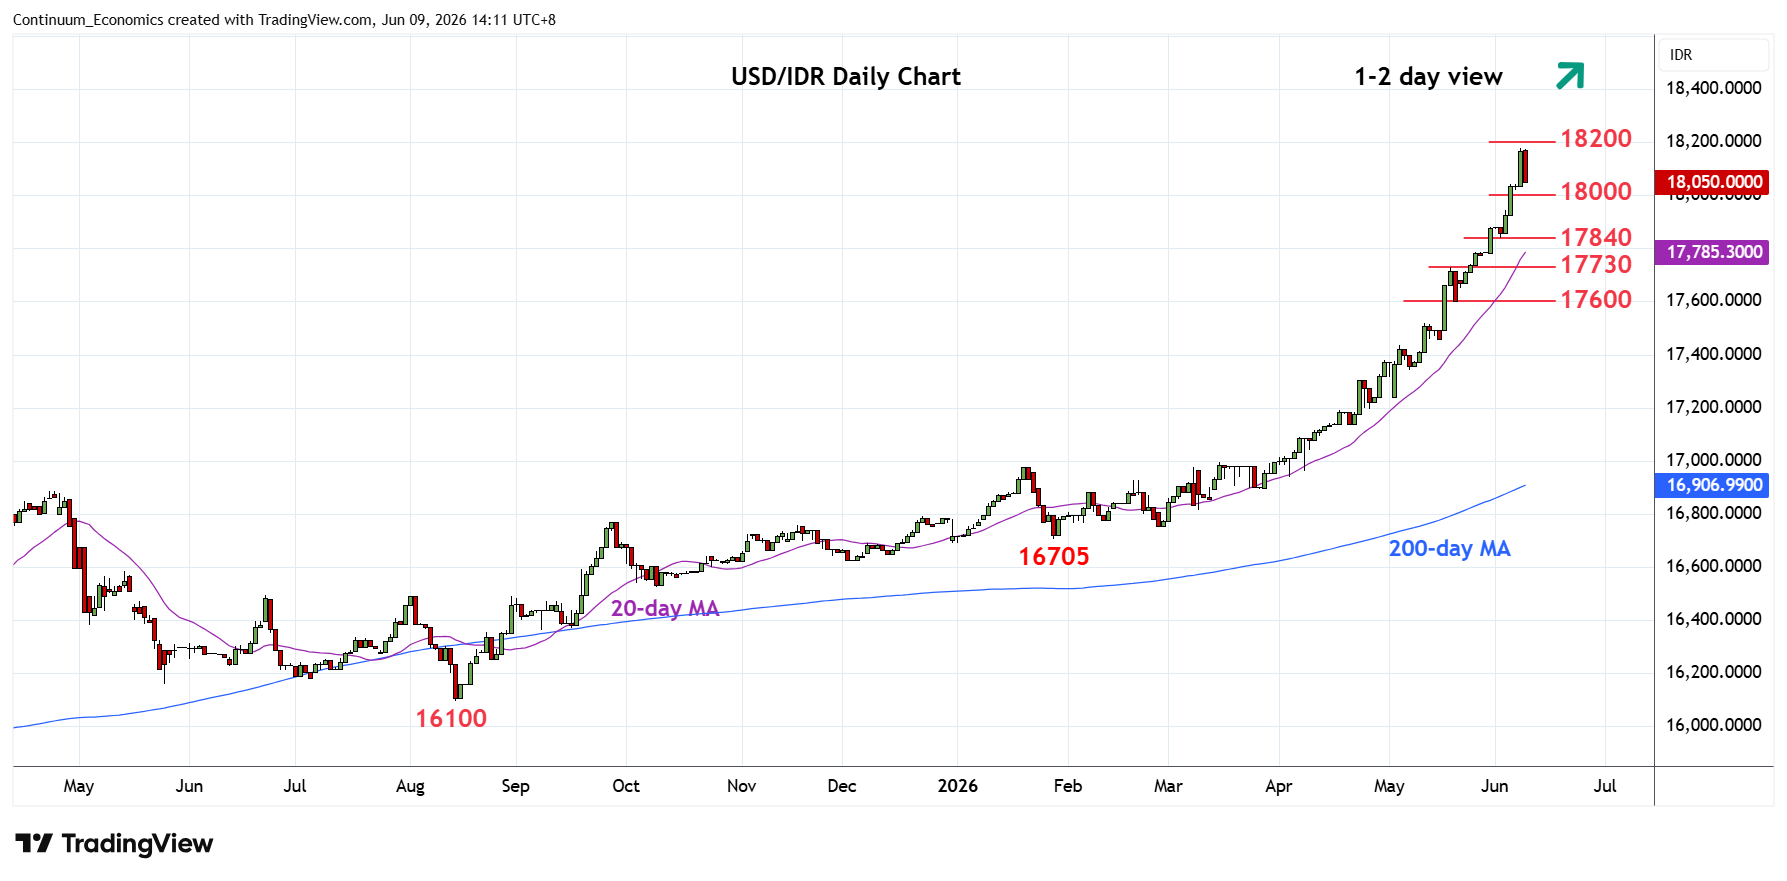
Settling back from the 18180 all-time high as prices consolidate parabolic gains from the 16705, January current year low
| Levels | Imp | Comment | Levels | Imp | Comment | |||
|---|---|---|---|---|---|---|---|---|
| R4 | 19000 | projection | S1 | 18000 | * | figure | ||
| R3 | 18500 | projection | S2 | 17840 | * | 2 Jun low | ||
| R2 | 18200 | projection | S3 | 17730 | * | 19 May high | ||
| R1 | 18180 | ** | 8 Jun all-time high | S4 | 17600 | * | congestion |
Asterisk denotes strength of level
06:10 GMT - Settling back from the 18180 all-time high as prices consolidate parabolic gains from the 16705, January current year low. Prices are unwinding overbought intraday and daily studies and suggest room for pullback to support at the 18000 level. Weekly studies are stretched as well and suggest potential for break here to open up room for deeper correction to the 17880/17840 congestion area and 17730 support. Meanwhile, resistance at the 18180 high is expected to cap.