Published: 2026-09-24T02:58:26.000Z
Chart USD/MYR Update: Higher in consolidation
2
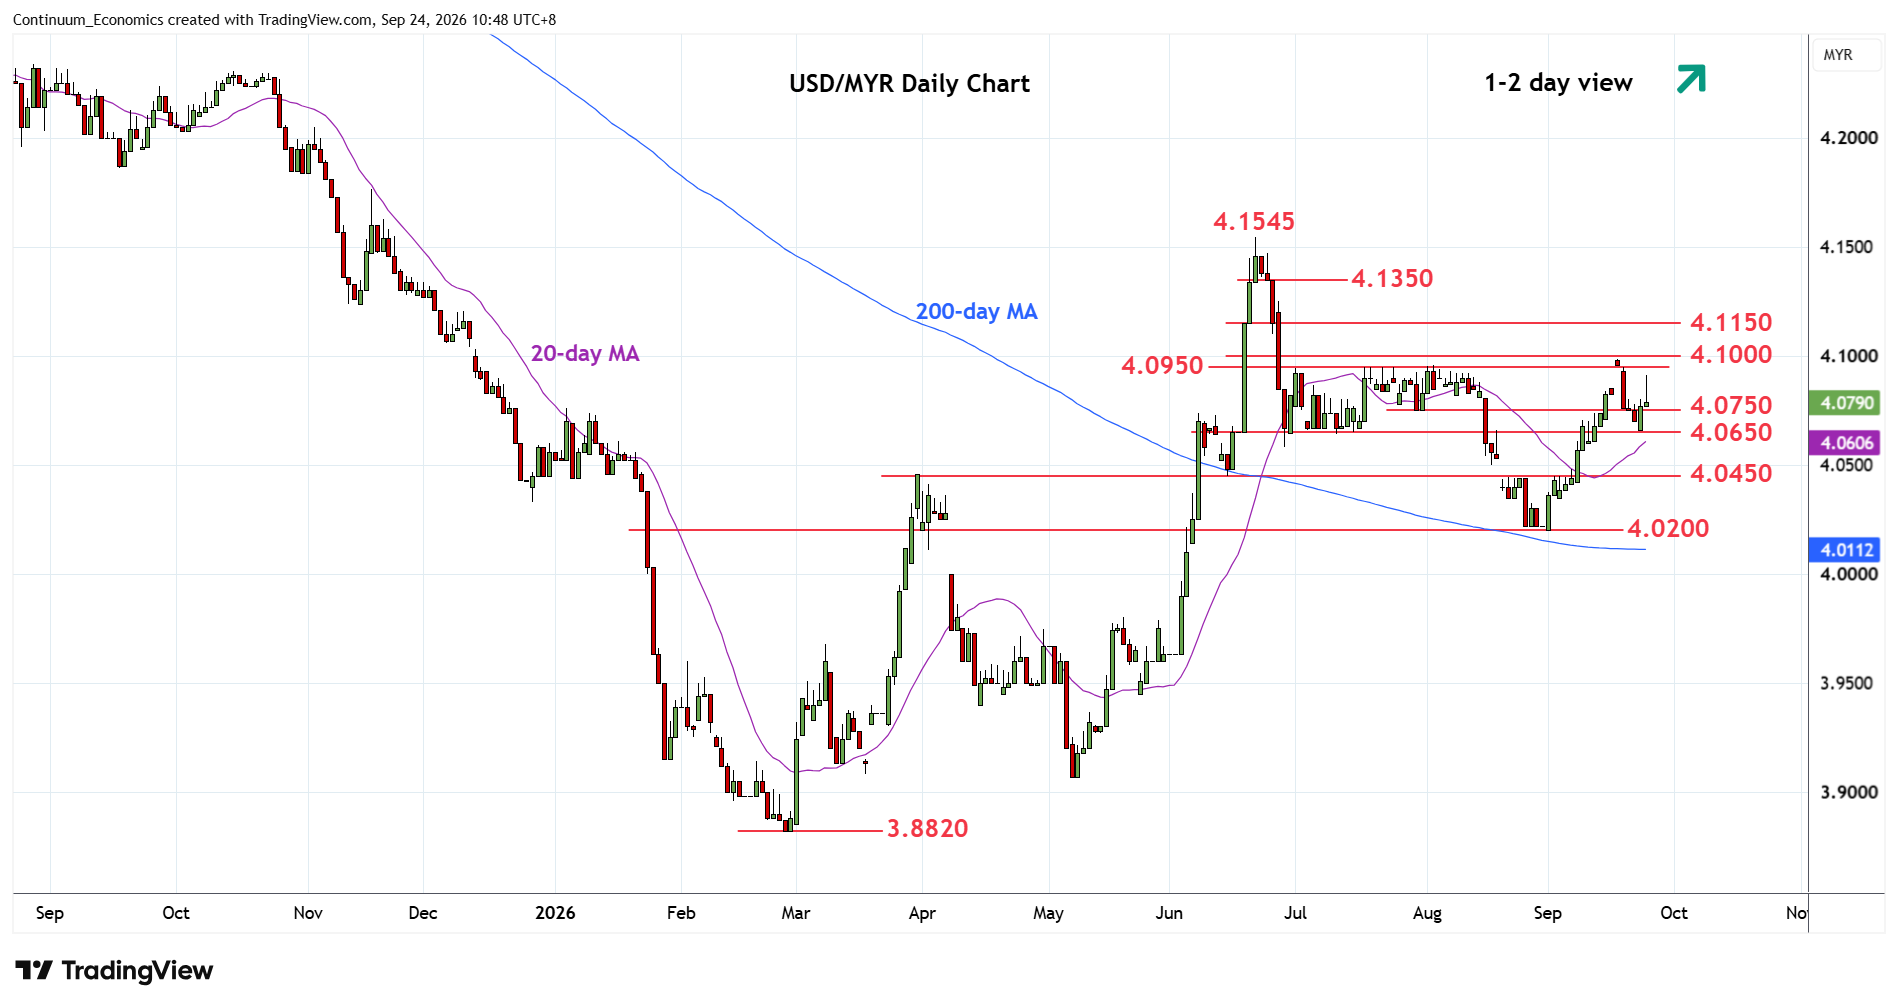
Consolidation above 4.0650 July low has given way to bounce to reach towards the 4.0950/4.1000 resistance
| Levels | Imp | Comment | Levels | Imp | Comment | |||
|---|---|---|---|---|---|---|---|---|
| R4 | 4.1350 | * | congestion | S1 | 4.0750 | * | 30 Jul low | |
| R3 | 4.1250 | * | 26 Jun high | S2 | 4.0650/600 | * | Jul low, congestion | |
| R2 | 4.1150 | * | congestion | S3 | 4.0450 | ** | 2 Sep high | |
| R1 | 4.0950/00 | ** | Jul high, congestion | S4 | 4.0200 | ** | 1 Sep low, congestion |
Asterisk denotes strength of level
02:50 GMT - Consolidation above 4.0650 July low has given way to bounce to reach towards the 4.0950/4.1000 resistance. Daily studies have turned mixed but positive weekly chart suggest scope for break here to extend the broader gains from 4.0200 low. Higher will see room to the 4.1150/4.1350 congestion area. Clearance here will expose the 4.1545 June current year high to retest. Meanwhile, support is raised to the 4.0750/4.0650 area which should underpin. Would take break here to fade the upside pressure and see deeper pullback to retrace strong gains from the 4.0200 low.