Published: 2026-07-31T05:05:45.000Z
Chart USD/IDR Updates: Extending consolidation
2
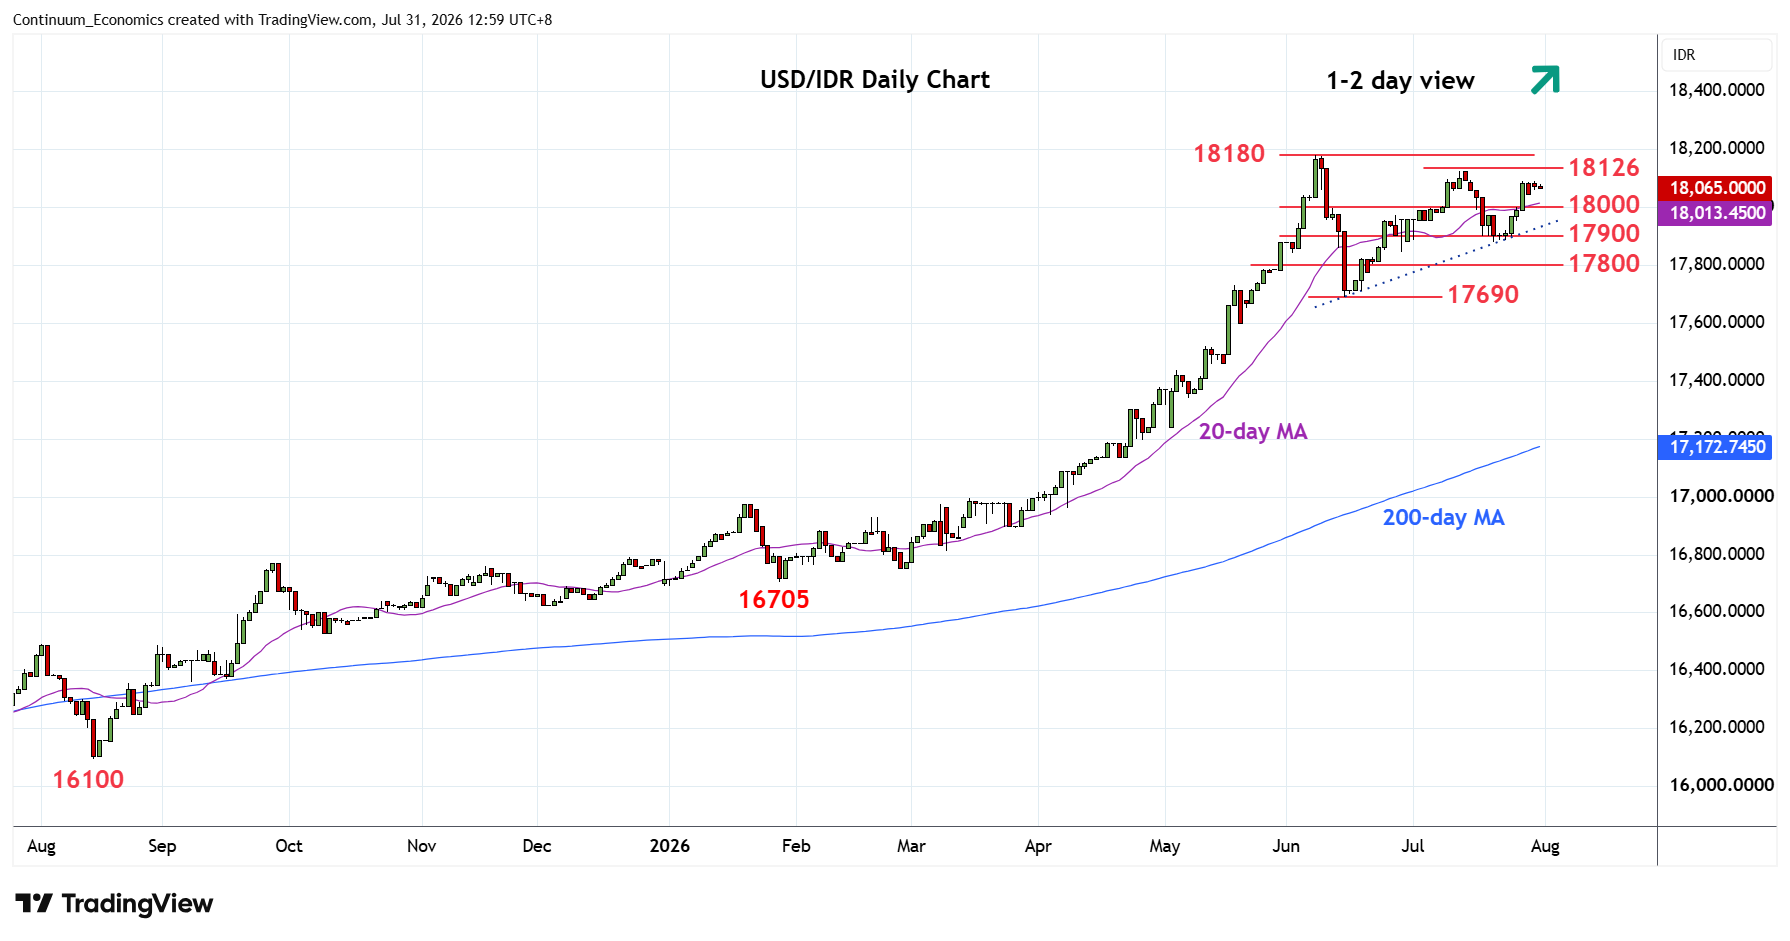
Little change, as prices extending consolidation below the 18090 high following bounce from the 17900/17880 low of last week
| Levels | Imp | Comment | Levels | Imp | Comment | |||
|---|---|---|---|---|---|---|---|---|
| R4 | 18200 | projection | S1 | 18000 | * | congestion | ||
| R3 | 18180 | ** | 8 Jun all-time high | S2 | 17880 | ** | 21 Jul low | |
| R2 | 18126 | ** | 13 Jul high | S3 | 17845 | * | 29 Jun low | |
| R1 | 18090 | * | 28 Jul high | S4 | 17800 | * | congestion |
Asterisk denotes strength of level
05:05 GMT - Little change, as prices extending consolidation below the 18090 high following bounce from the 17900/17880 low of last week. However, pressure remains on the upside with the ascending triangle from the June low suggesting scope for break to open up room for retest of the 18126, 13 July high. Above here will see room for retest of the 18180, June all-time high. Meanwhile, support is raise to the 18000 level which should underpin. Only below here will ease the upside pressure and see room for consolidation back to the 17900/17880 support.