Published: 2026-07-28T04:58:01.000Z
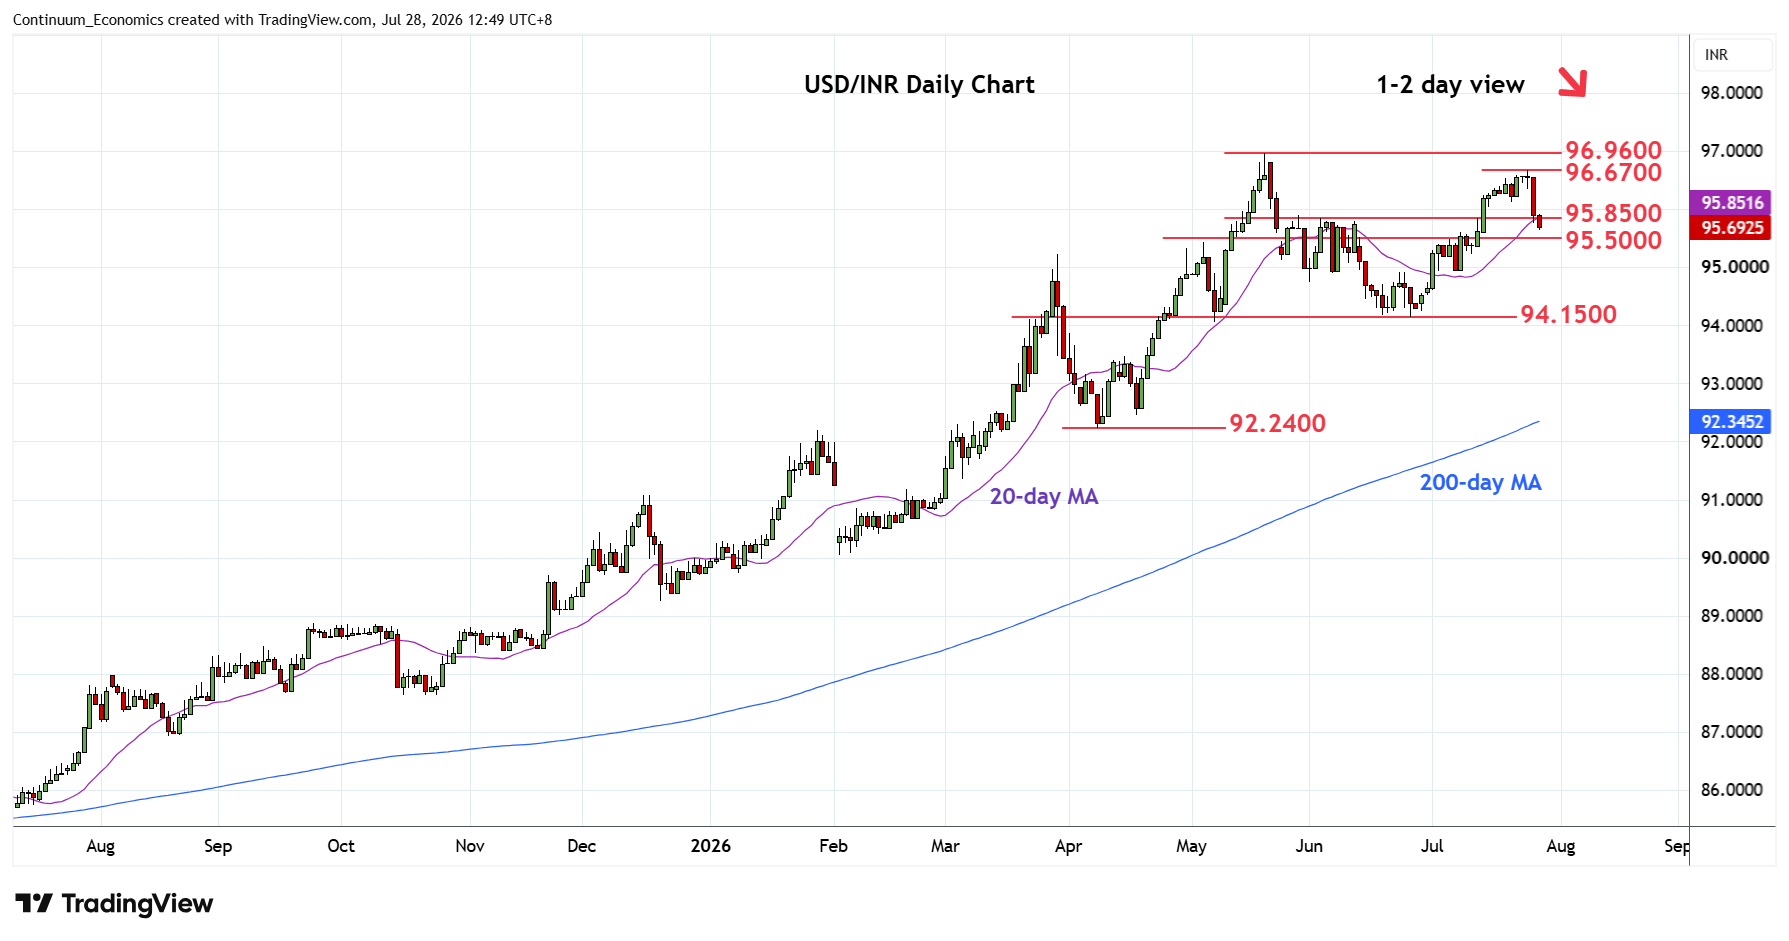
Chart USD/INR Update: Extending pullback from 96.6700 high
4
Sharp pullback from the 96.6700 Friday's high see prices unwinding overbought daily studies
| Level | Comment | Level | Comment | |||||
|---|---|---|---|---|---|---|---|---|
| R4 | 97.0000 | * | figure | S1 | 95.5000 | * | congestion | |
| R3 | 96.9600 | ** | 20 May all-time high | S2 | 94.9000 | ** | 23 Jun high | |
| R2 | 96.6700 | * | 24 Jul high | S3 | 94.1500 | ** | Jun low | |
| R1 | 96.0000 | * | congestion | S4 | 93.4700 | * | 15 Apr high |
Asterisk denotes strength of level
05:00 GMT - Sharp pullback from the 96.6700 Friday's high see prices unwinding overbought daily studies. Break of support at the 95.9000/95.8500 area fades the upside pressure and open up room for deeper retracement to 95.5000 congestion. Below this will see room to strong support at 95.0000/94.9000 area. Meanwhile, resistance is lowered to the 96.0000 congestion which should cap and sustain losses from the 96.6700 high of 24 July.