Chart USD/MXN Update: Balanced above fresh year lows - studies deteriorating
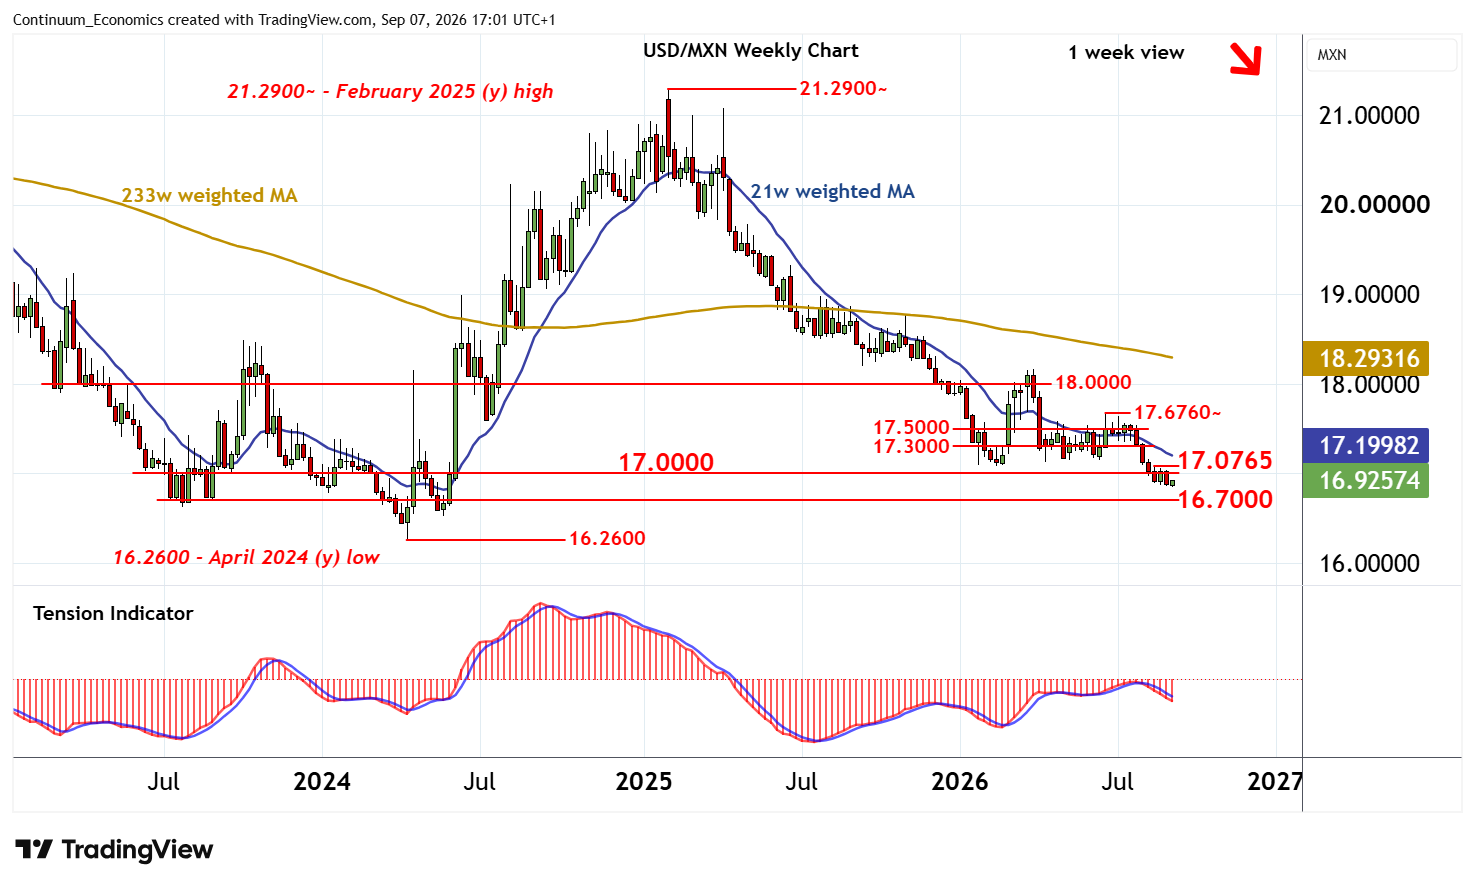
The break back below 17.0000 has posted a fresh year low around 16.8500
| Levels | Imp | Comment | Levels | Imp | Comment | |||
|---|---|---|---|---|---|---|---|---|
| R4 | 17.3000 | * | break level | S1 | 16.8750 | intraday low | ||
| R3 | 17.2000 | * | break level | S2 | 16.7000 | * | congestion | |
| R2 | 17.0765 | * | 18 Aug (w) high | S3 | 16.5275 | * | May 2024 low | |
| R1 | 17.0000 | ** | congestion | S4 | 16.2600 | ** | April 2024 (y) low |
Asterisk denotes strength of level
16:40 BST - The break back below 17.0000 has posted a fresh year low around 16.8500, where fresh short-term consolidation is appearing. Daily stochastics and the daily Tension Indicator are coming under pressure, highlighting room for further losses in the coming sessions. But oversold weekly stochastics are rising, suggesting potential for further consolidation before February 2025 losses resume and focus turns to congestion around 16.7000.
Meanwhile, resistance remains at congestion around 17.0000 and extends to the 17.0765 weekly high of 18 August. This range should cap any immediate tests higher. A close above here, however, will improve sentiment and extend gains towards strong resistance at 17.3000.