Published: 2026-08-11T02:56:07.000Z
Chart USD/MYR Update: Extend consolidation
2
Little change, as prices extend consolidation within a narrow range below the 4.0950 resistance
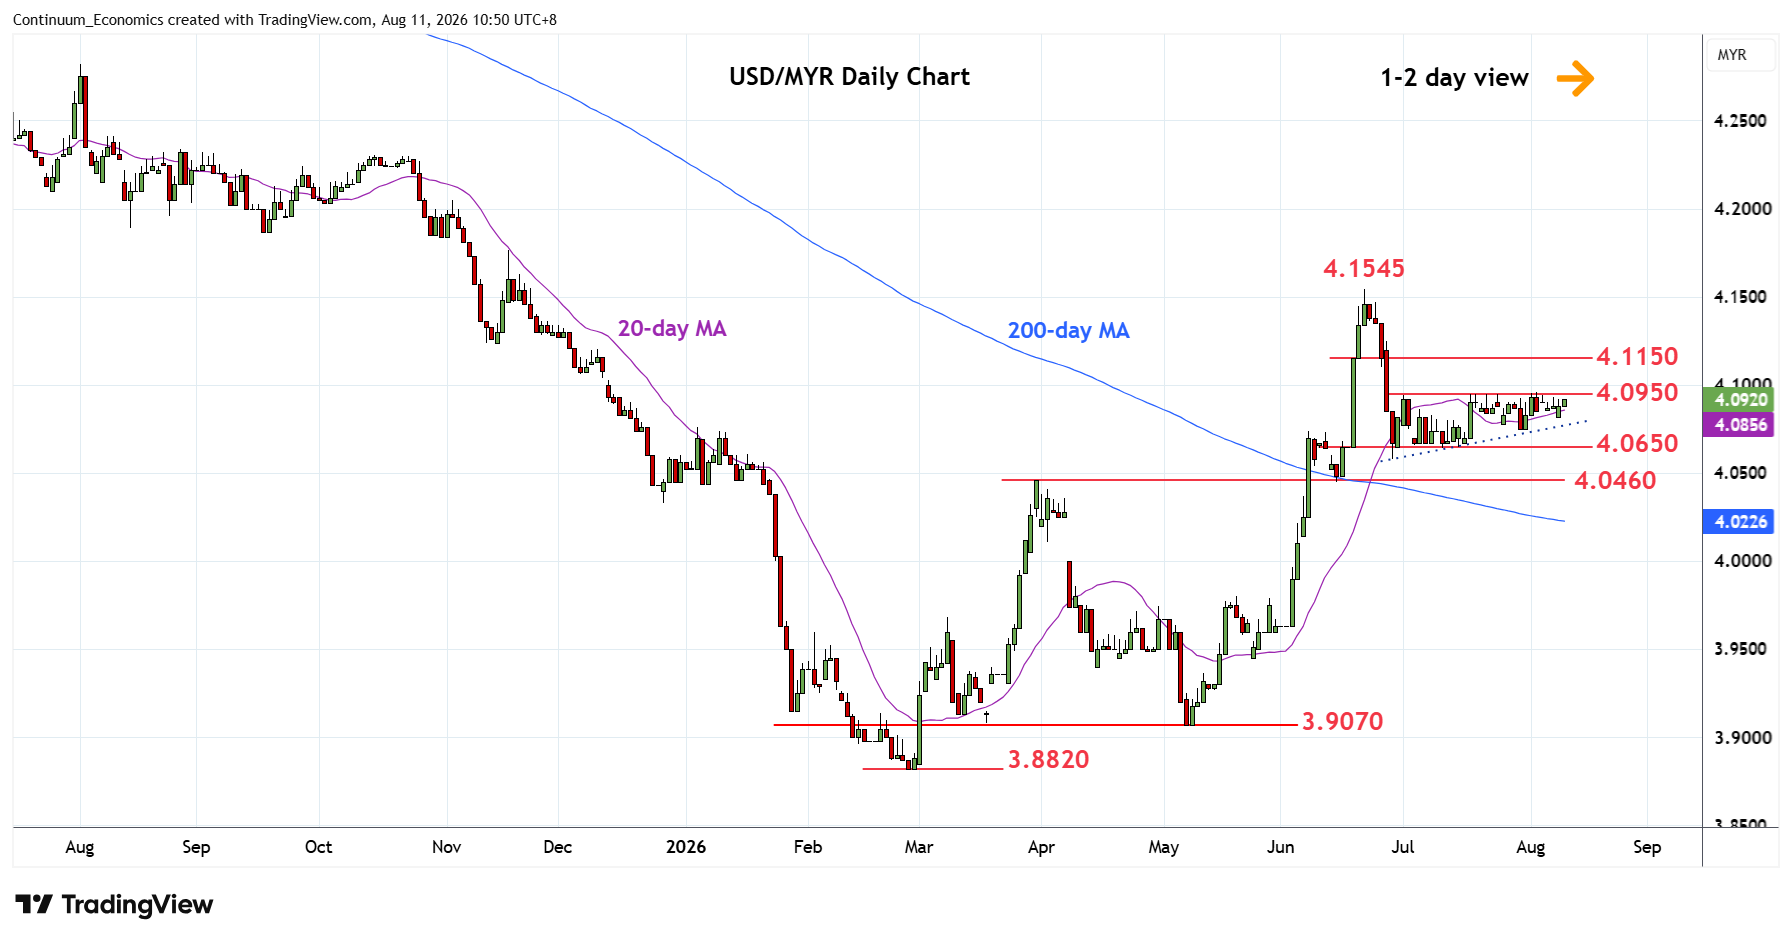
| Levels | Imp | Comment | Levels | Imp | Comment | |||
|---|---|---|---|---|---|---|---|---|
| R4 | 4.1545 | ** | 22 Jun YTD high | S1 | 4.0750/00 | 30 Jul low | ||
| R3 | 4.1350 | * | congestion | S2 | 4.0650/00 | ** | congestion | |
| R2 | 4.1150 | * | congestion | S3 | 4.0460 | ** | Mar high | |
| R1 | 4.0950 | * | Jul high | S4 | 4.0200 | * | congestion |
Asterisk denotes strength of level
02:55 GMT - Little change, as prices extend consolidation within a narrow range below the 4.0950 resistance. However, upside bias from the late-June low at 4.0600 suggest scope for break of the 4.0950 resistance to retrace losses from the 4.1545, June swing high. Clearance will see room to resistance at the 4.1150/4.1200 area. However, negative weekly studies suggest gains giving way to renewed selling pressure later. Below support at the 4.0750/4.0650 area and 4.0600 low will see room for deeper pullback to retrace the May/June rally to strong support at 4.0460/4.04600 area.