Published: 2026-09-22T07:07:08.000Z
Chart USD/TWD Update: Extending pullback from 31.950 high
2
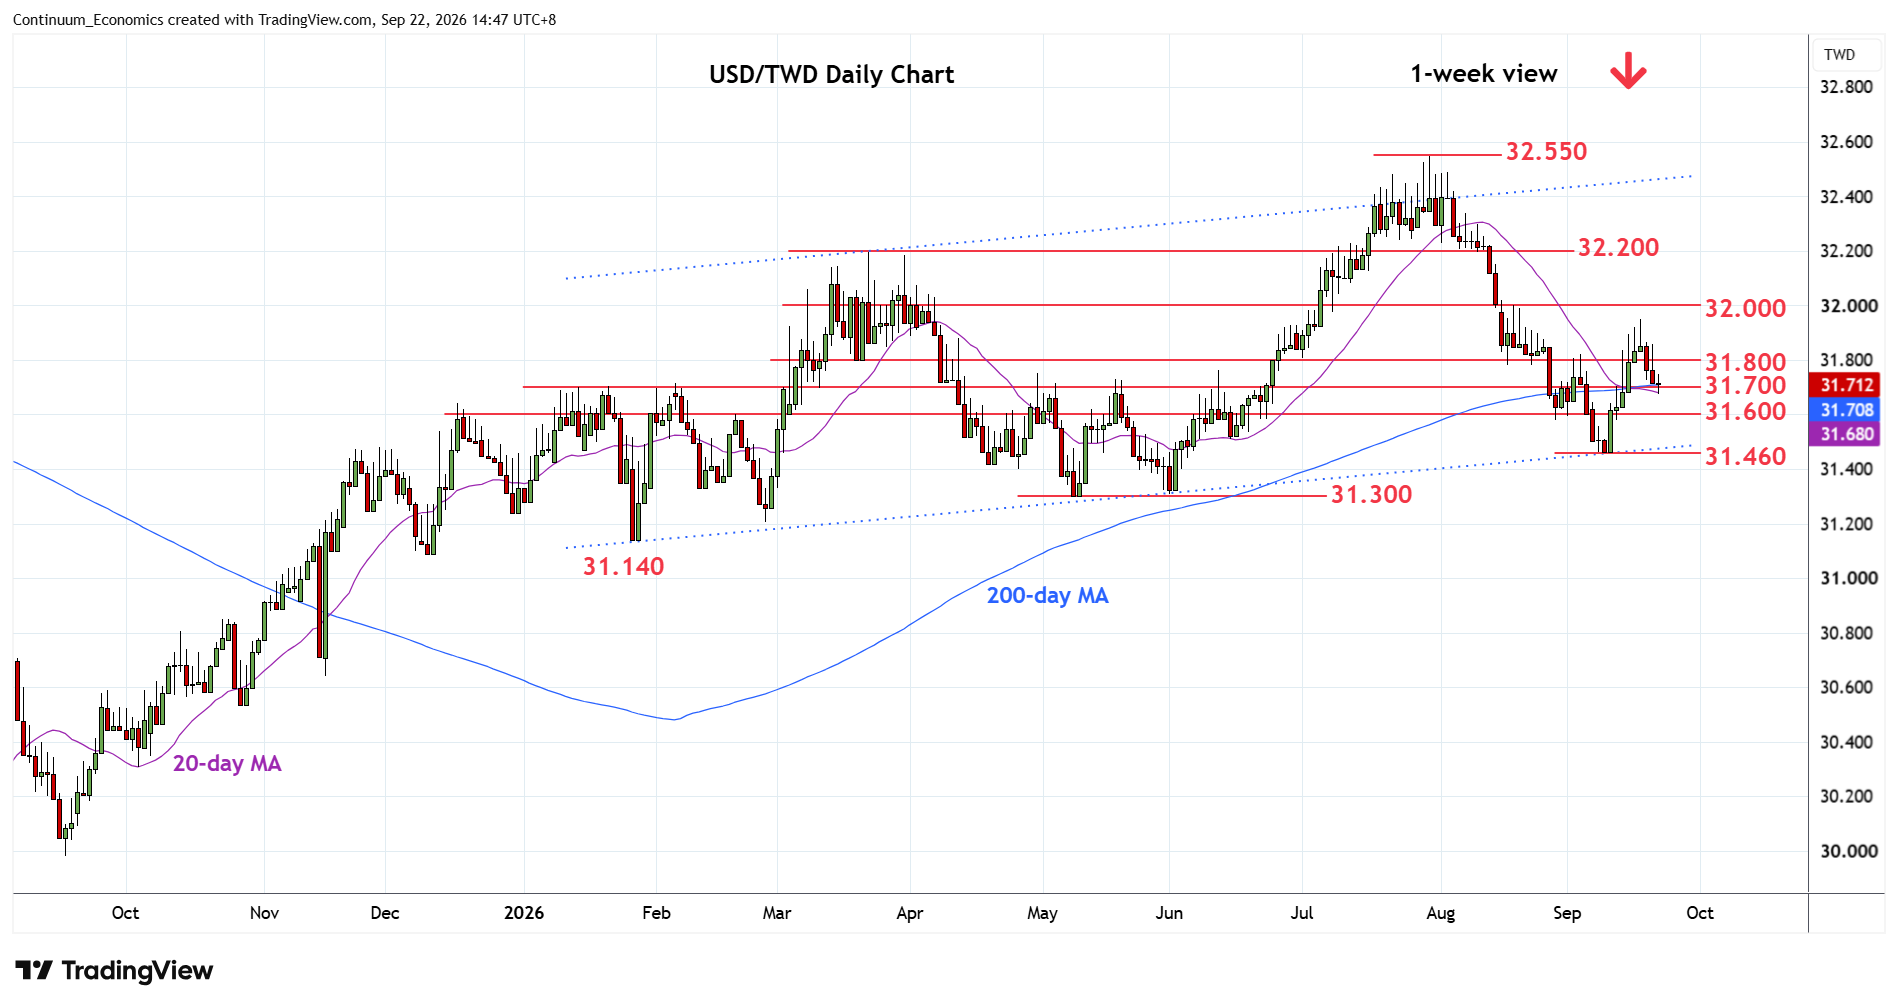
Extending rejection from the 31.950 high of last week as corrective bounce gives way to fresh selling pressure
| Levels | Imp | Comment | Levels | Imp | Comment | |||
|---|---|---|---|---|---|---|---|---|
| R4 | 32.100 | * | congestion | S1 | 31.700 | * | congestion | |
| R3 | 32.000 | * | figure, congestion | S2 | 31.600 | * | congestion | |
| R2 | 31.950 | ** | 17 Sep high | S3 | 31.460 | ** | 9 Sep low | |
| R1 | 31.800 | * | congestion | S4 | 31.400 | * | congestion |
07:00 GMT - Extending rejection from the 31.950 high of last week as corrective bounce gives way to fresh selling pressure. Daily studies have turned lower to unwind overbought readings and below 31.700 will see room to support at 31.600 congestion. Below here will return focus to the downside for retest of the 31.460 low. Break of the latter will see deeper pullback to retrace rally from the July 2025 year low and see room to retest 31.300, May low. Meanwhile, resistance at 31.800 congestion and extending to 31.950 high expected to cap and sustain losses from the 32.550, July current year