Published: 2026-06-29T02:30:42.000Z
Chart USD/SGD Update: Leaning lower from the 1.2985 resistance
1
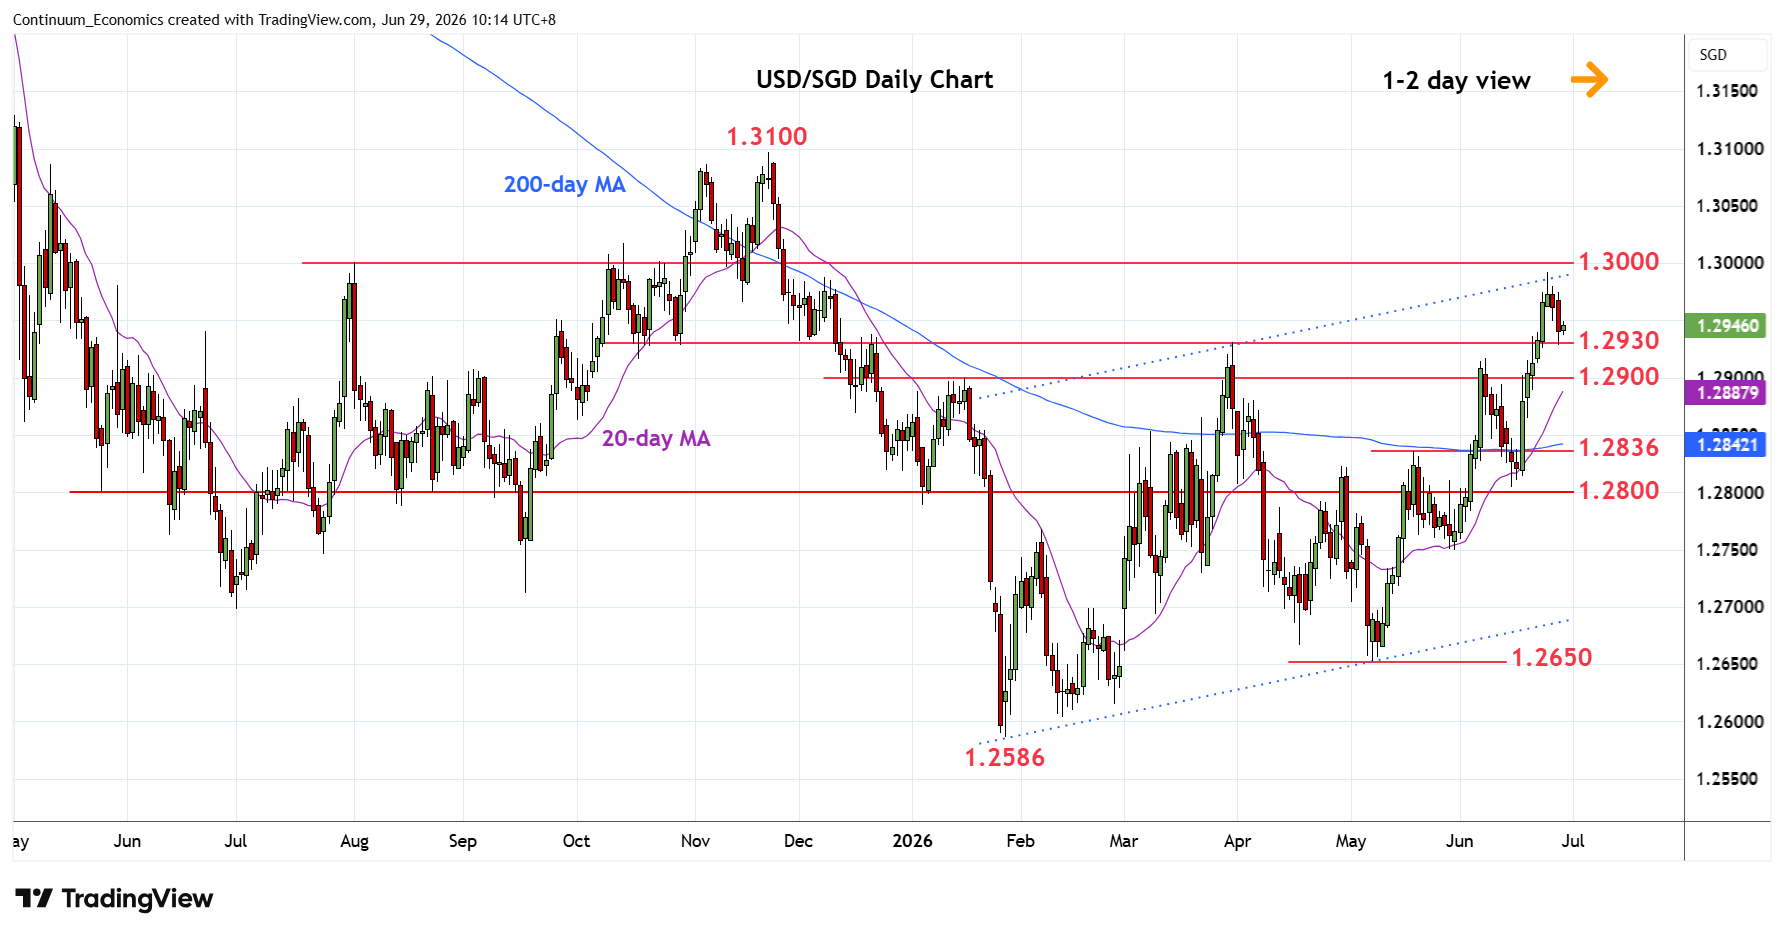
Leaning lower in consolidation following test of the 1.2985 December high and channel resistance from the January low.
| Level | Comment | Level | Comment | ||||
|---|---|---|---|---|---|---|---|
| R4 | 1.3100 | ** | Nov high | S1 | 1.2930 | * | Mar high |
| R3 | 1.3050 | * | congestion | S2 | 1.2900 | * | congestion |
| R2 | 1.3000 | ** | figure, congestion | S3 | 1.2850/36 | ** | congestion, May high |
| R1 | 1.2985 | ** | Dec high, channel | S4 | 1.2805/00 | ** | 15 Jun low, congestion |
Asterisk denotes strength of level
02:20 GMT - Leaning lower in consolidation following test of the 1.2985 December high and channel resistance from the January low. Daily studies are unwing overbought reading and suggest scope for pullback to support at 1.2930/00 March high and congestion area. Break here will ease the upside pressure and see room for deeper pullback to strong support at the 1.2850/36 congestion and May high. Meanwhile, break above resistance at the 1.2985 high will open up room for extension to 1.3000/50 congestion.