Published: 2026-06-09T02:30:51.000Z
Chart USD/SGD Update: Backed off from test of 1.2900/30 resistance
1
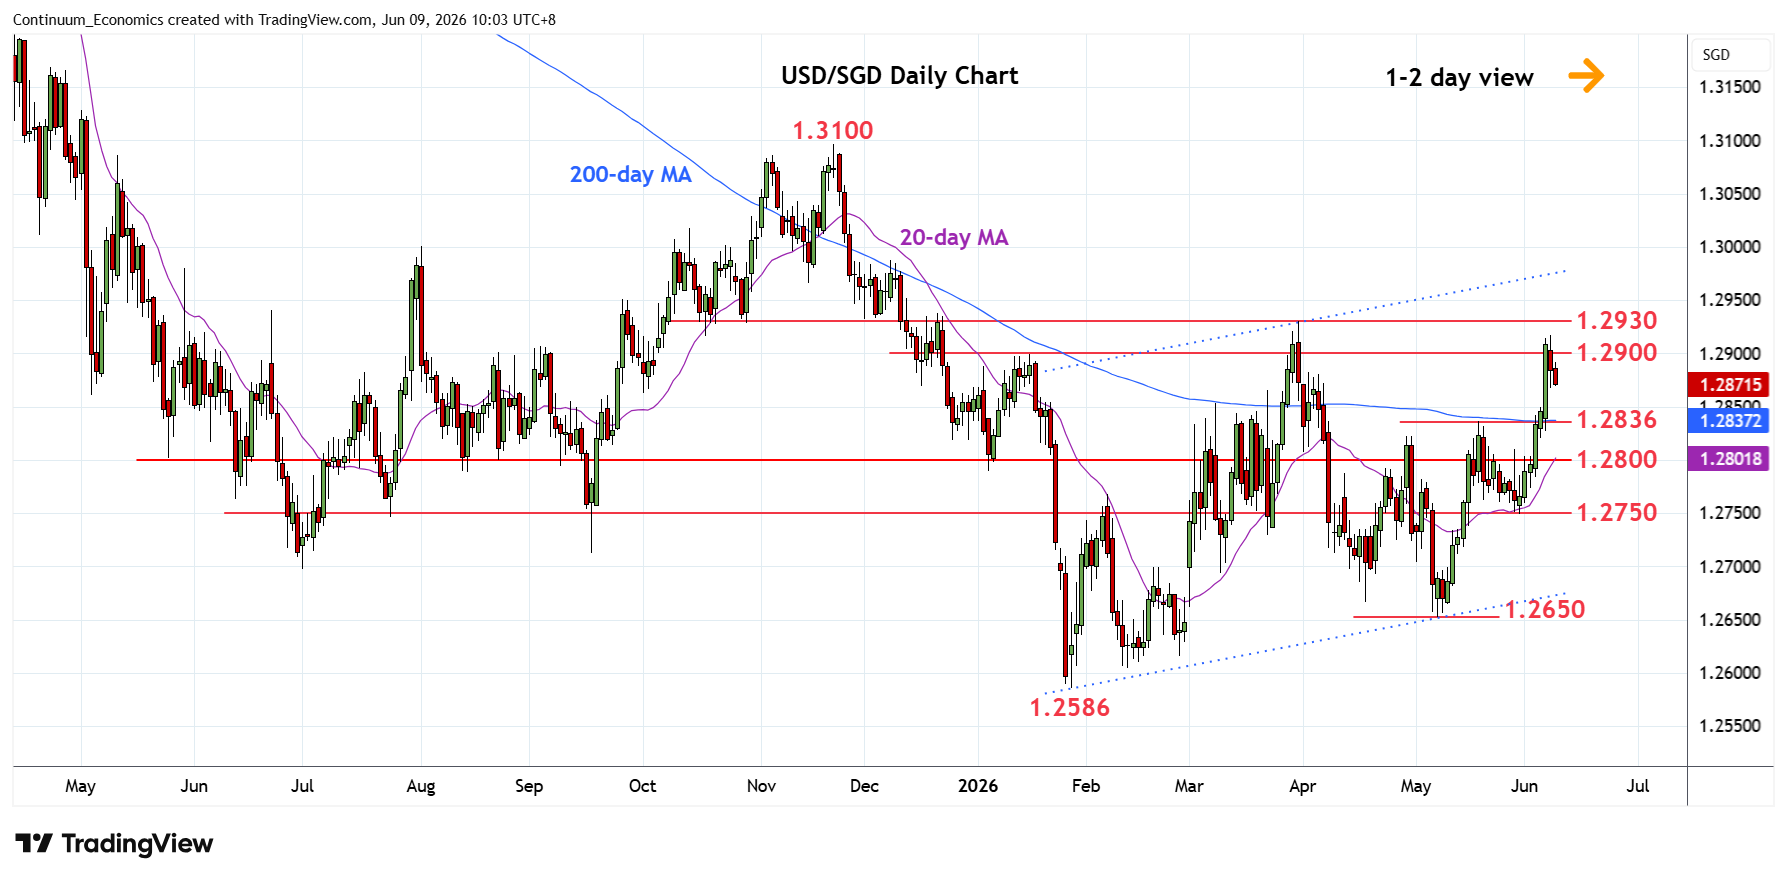
Turned back from test of strong resistance at the 1.2900/30 congestion and March curent year high
| Level | Comment | Level | Comment | ||||
|---|---|---|---|---|---|---|---|
| R4 | 1.3000 | ** | figure, congestion | S1 | 1.2850 | * | congestion |
| R3 | 1.2950 | * | congestion | S2 | 1.2836 | ** | May high |
| R2 | 1.2930 | ** | 31 Mar YTD high | S3 | 1.2800 | * | congestion |
| R1 | 1.2900 | * | congestion | S4 | 1.2750 | ** | 29 May low |
Asterisk denotes strength of level
02:25 GMT - Turned back from test of strong resistance at the 1.2900/30 congestion and March curent year high as prices unwind overbought intraday and daily studies. Pullback see support starting at the 1.2850/36 congestion and May high which should underpin. Break here will fade the upside pressure and open up room for deeper pullback to support at 1.2800 congestion then 1.2750 low of 29 May. Meanwhile, break above 1.2900/30 resistance, if seen, will extend the broader gains from the January YTD low to further retrace losses from the 1.3100, November 2025 high.