Published: 2026-09-08T02:38:34.000Z
Chart USD/MYR Update: Pressuring 4.0460/4.0500 resistance
2
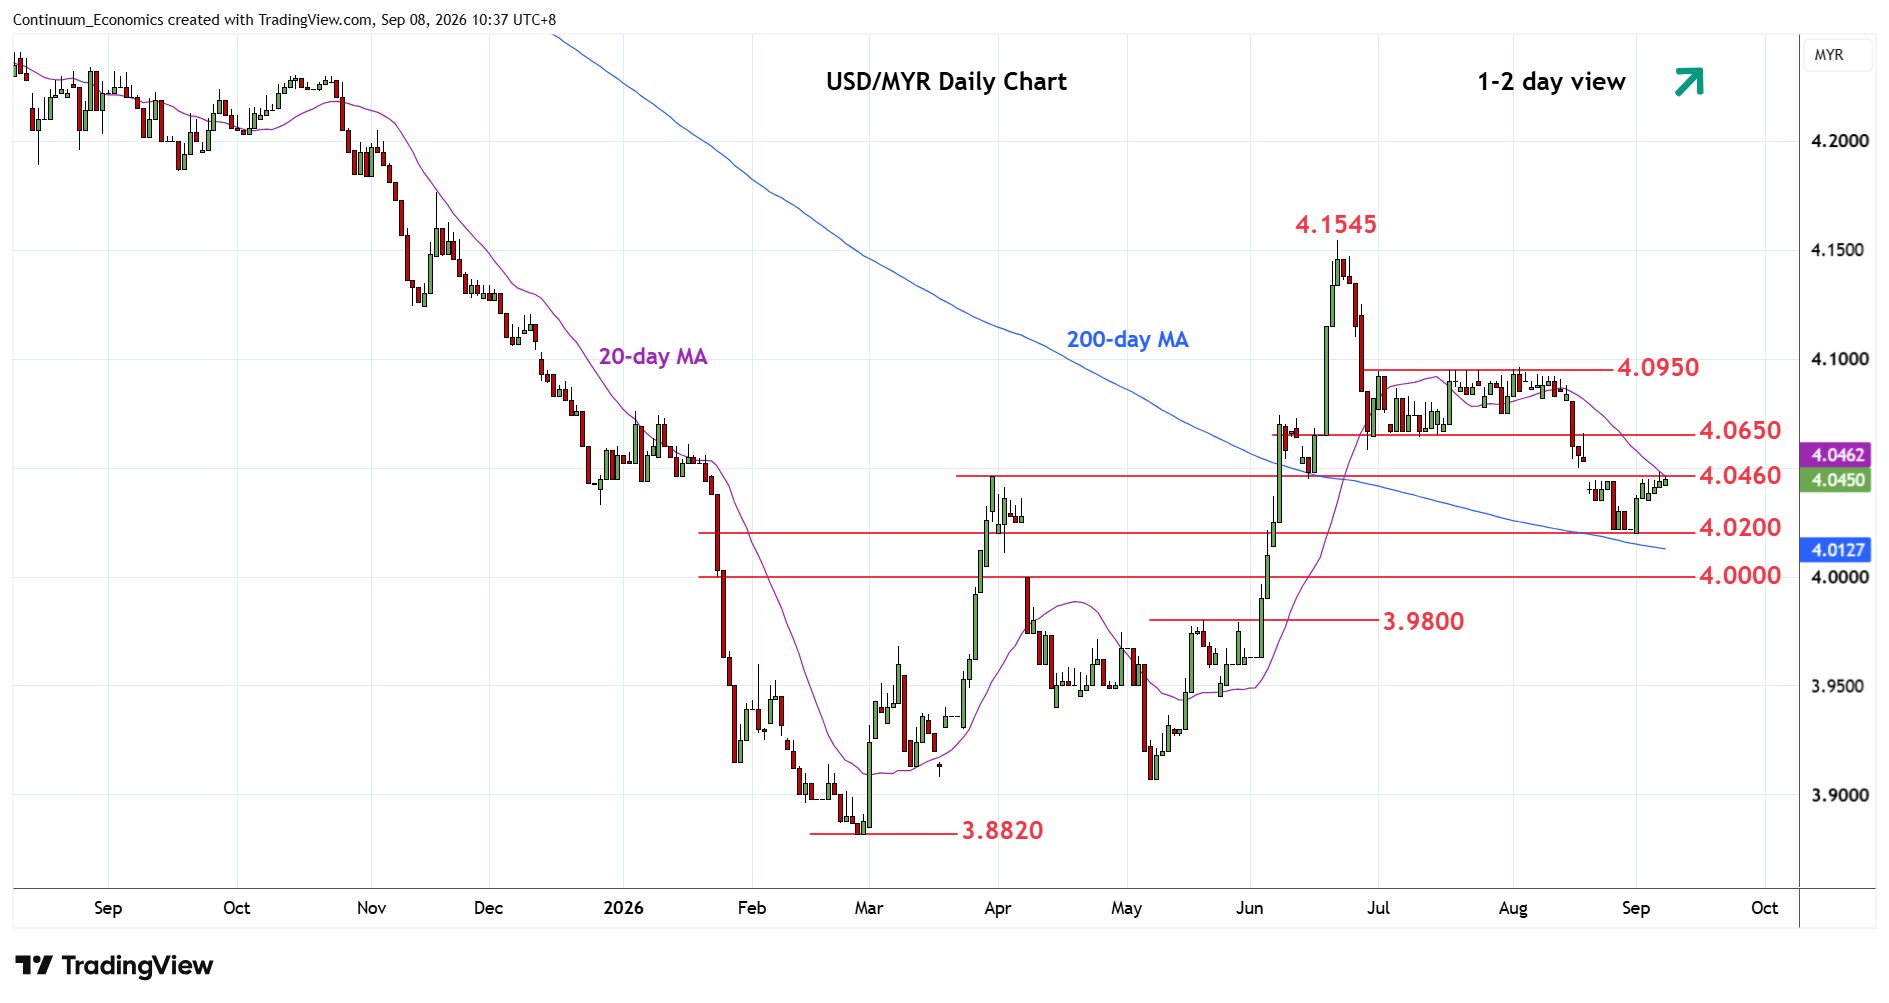
Pressuring resistance at the 4.0460/4.0500 area following bounce from the 4.0200 low
| Levels | Imp | Comment | Levels | Imp | Comment | |||
|---|---|---|---|---|---|---|---|---|
| R4 | 4.0800 | congestion | S1 | 4.0200 | * | congestion | ||
| R3 | 4.0750 | * | 30 Jul low | S2 | 4.0000 | ** | figure, 61.8% | |
| R2 | 4.0650 | ** | congestion | S3 | 3.9800 | ** | May high | |
| R1 | 4.0460/500 | * | Mar high, congestion | S4 | 3.9600 | * | congestion |
Asterisk denotes strength of level
02:35 GMT - Pressuring resistance at the 4.0460/4.0500 area following bounce from the 4.0200 low. Daily and weekly studies have turned up to unwind oversold readings and suggest scope for break here to open up room for stronger gains to retrace losses from the 4.0950, July high. Break here will see room to strong resistance at 4.0600/4.0650 level and July low which is expected to cap. Meanwhile, support remains at the 4.0200 low. Below here will extend the June losses and see scope to target the 4.0000 figure and 61.8% Fibonacci level. Lower still, will see room to strong support at the 3.9800, May high.